BNSF Railway
33,000 route miles
28 US states
3 Canadian provinces
~8,000 locomotives
~35,000 employees
2025 Revenue
$23.5 B
2025 Net Profit
$5.5 B
2025 Net Margin
23%
2025 Op. Ratio
65.5%
2025 Capex
$3.8 B
2025 Dividend
$4.4 B
Lifetime Dividends to BRK
$62 B
Growth Summary CAGR
| Metric $ in billions |
2025 | 1-Year | 3-Year | 5-Year | 10-Year | 15-Year |
|---|
Revenue & Net Profit — BNSF vs UNP (2007–2025)
1) 2017 net profit adjusted for Tax Cuts & Jobs Act one-time benefit
Operating Ratio — BNSF vs UNP (2007–2025) · Lower is better
"The gap to the industry's best remains too wide and closing it will require continued improvements in efficiency and service. The team recognizes the significance of this opportunity, and we will be disappointed if we do not deliver a substantial improvement over the next few years."
— Greg Abel, CEO · 2025 Annual Report
UNP Year-End Valuation Multiples (2007–2025)
Year-end P/E and EV/EBITDA multiples for Union Pacific. Simple average used in implied BNSF valuation below.
BNSF Implied Valuation
UNP avg multiples (2007–2025) applied to BNSF 2025 financials
| Multiple $ in billions |
UNP Avg (2007–2025) | BNSF 2025 | BNSF Implied Value |
|---|
Financial Performance
| Year $ in billions |
Revenue | Net Profit | Op. Ratio | Net Mgn | Rev Growth | NP Growth | ROE | Capex | Dividends |
|---|
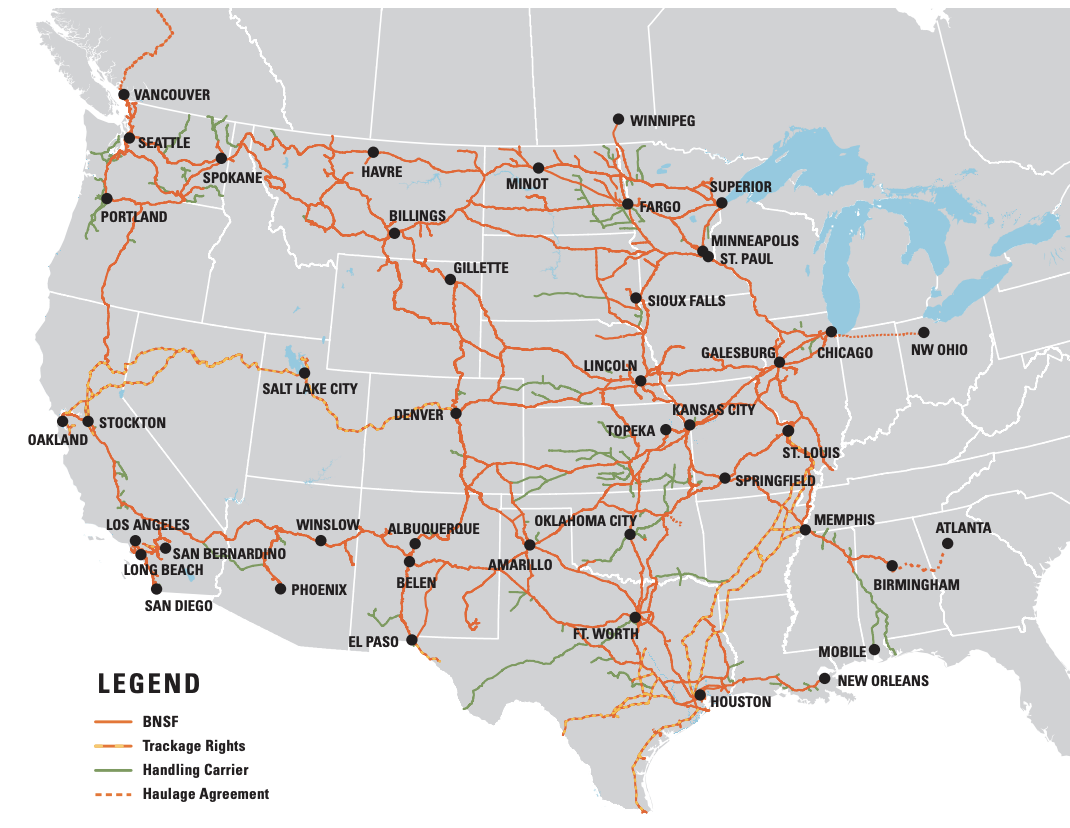
Network Coverage
BNSF route miles, trackage rights & haulage agreements