A railroad that has already paid for itself
Berkshire bought the three-quarters of BNSF it did not already own in 2010. The railroad has since sent more than twice the purchase price back in dividends, while spending even more than that again on its own track. Both halves of that sentence matter.
BNSF has already paid Berkshire more in dividends than Berkshire paid to buy it, the railroad has returned its own purchase price and still belongs to the company.
- 1 The dividends alone have repaid the purchase price 2.4× over, and Berkshire still owns the railroad. That is the return this acquisition is judged on, not the earnings multiple.
- 2 BNSF runs a less efficient railroad than Union Pacific, and has for a decade. The 6.3-point gap in operating ratio is worth about $1.5 B of pre-tax profit a year at current revenue, the clearest identifiable improvement available anywhere in Berkshire.
- 3 The valuation is less demanding than the market’s own. UNP’s year-end multiple has run between 10.3× and 26.1× since 2007, with a median of 20×. BNSF is carried here at 20×.
What the cheque bought
An acquisition is usually judged on the multiple paid. That is the wrong test for a business held forever. The right test is cash: how much has come back, and what shape the asset is in when it does.
Berkshire paid $26.5 B in 2010 for the 77% of BNSF it did not own. Since then the railroad has paid $62.4 B up to the parent company, 2.4× the purchase price, while reinvesting $59.2 B in its own track, locomotives and terminals.
What it bought was not a company so much as a map. The network below is the asset: 33,000 route miles across the western two-thirds of the country, assembled over a century and a half and impossible to assemble again at any price.
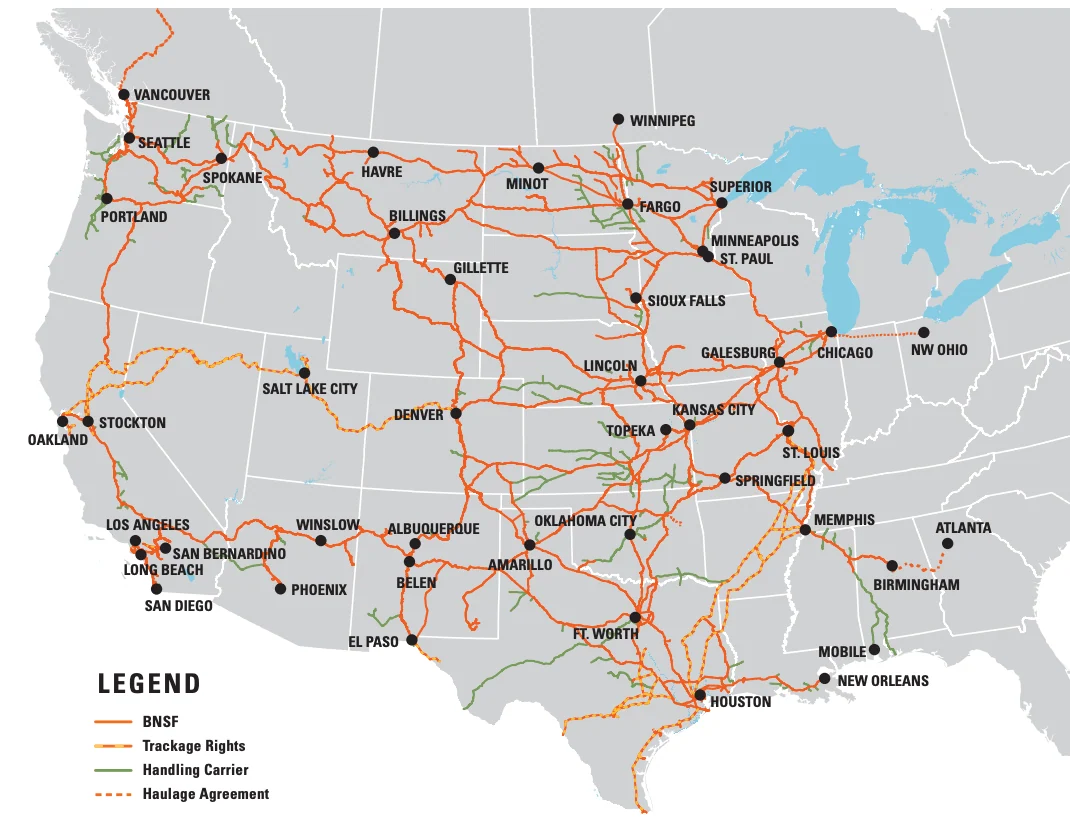
The takeaway $62.4 B returned against $26.5 B paid, and Berkshire still owns a railroad earning $5.5 B a year. The valuation below asks what that earnings stream is worth; the cash above is already banked.
A business that funds its own renewal
Railroads are the textbook capital-intensive business: track wears out, and replacing it is not optional. BNSF has spent $59.2 B on capital expenditure since the acquisition, more than the purchase price, and still paid the dividends above out of what was left.
This is the quality that attracted Buffett and the reason the business is worth less than its earnings multiple suggests in isolation. A dollar of BNSF earnings is not a dollar of free cash, a large share of it goes back into the ground every year just to stand still.
The number Berkshire does not like to discuss
The western United States has two big railroads. BNSF is one; Union Pacific is the other. They run over much the same geography, haul much the same freight, and are therefore the only honest comparison either one has.
The industry’s measure of efficiency is the operating ratio: operating costs as a share of revenue, so lower is better. BNSF has improved from 73.3% in 2010 to 65.6% in 2025. UNP has improved faster, to 59.3%.
That gap is worth about $1.5 B a year. 6.3 percentage points of a $23.4 B revenue base is pre-tax profit that BNSF does not earn and UNP does, every year. At the 20× multiple used in this valuation, closing even half of it would be worth real money.
“The gap to the industry’s best remains too wide and closing it will require continued improvements in efficiency and service. The team recognizes the significance of this opportunity, and we will be disappointed if we do not deliver a substantial improvement over the next few years.”
Greg Abel · 2025 Annual Report
He priced it himself, and his figure agrees with the one above. The same letter puts roughly 230 million of incremental operating cash flow on each percentage point of operating margin. That is simply one percent of BNSF’s $23.4 B of revenue, which is the same multiplication this page performs, arrived at from the other direction. Apply his rate to the 6.3-point gap here and it comes to $1.45 B, against the $1.47 B struck from revenue. The two methods are one method.
His gap is 5.7 points, not 6.3, and the difference is basis. Abel measures BNSF against UNP’s reported operating ratio of 59.8%. This page recomputes both railroads from revenue and operating income so they sit on one basis, which puts UNP at 59.3% and widens the gap by half a point. On his basis the prize is $1.31 B a year; on this one, $1.47 B. Both are defensible and the range is the honest answer: something between $1.3 B and $1.5 B of pre-tax profit a year turns on closing it.
The takeaway This gap is the strongest argument for the upside case on this segment. BNSF is not a broken business, it earned $5.5 B and improved its operating ratio by 7.7 points over 15 years. But a competitor doing demonstrably better over the same track is evidence that the improvement is available.
Is 20× the right price for a railroad?
BNSF is not listed, so there is no market price to check against. There is, however, a listed railroad running the same freight over the same country, and the market has been pricing it every day since before the acquisition.
Since 2007, UNP has finished the year on multiples between 10.3× and 26.1×, with a median of 20×. It closed 2025 at 21.8×. This valuation carries BNSF at 20×, below the comparable, which is defensible given the operating-ratio gap above.
At the top of UNP’s historical range, BNSF would be worth $144 B. At the bottom, $57 B. That spread, $40 a share, is why the multiple is one of the five assumptions you can change on the main page.
Download the series (.xlsx) BNSF Railway, with Union Pacific as benchmark, with sources and the date it was struck written into the file. This page’s series only; there is no combined download.