
The same leverage as Mitsubishi, twice the return
Itochu is the one house of the five whose returns need no explaining away. It has never lost money in the record, never traded below book, and earns the best return on equity of the five. The interesting question is not whether that is true but where it comes from — and the answer is not borrowing.
Itochu earns a higher return on assets than Mitsubishi in every year of the record, on leverage the two houses now share. The gap between them is not balance-sheet risk. It is what the balance sheet is made of.
- 1 The return on equity is 14.6% against Mitsubishi’s 8.5%, and almost none of the difference is borrowing. Both decompose exactly: 5.7% on assets times 2.6× leverage here, against 3.5% times 2.4× there. The leverage is within 0.2 of a turn. The productivity is not close.
- 2 The floor is the story, not the average. Itochu’s worst year in the record earned 12.7% on equity, in 2021. Mitsubishi’s worst earned 3.2%, in the same year. Three of the five houses have no loss year, so that is not what sets this one apart — the distance between a good year and a bad one is.
- 3 The best-returning line in the segment table is the one the disclosure does not explain. “Others, adjustments and eliminations” earned ¥197.6 B in the latest year — 22.0% of the group’s profit, at 10.1% on the ¥2.0 tn it carries, the highest rate of any segment. It is also the only one with no description attached to it.
- 4 The 15% target is 0.4 points away, and the committed buyback alone more than covers it. Reaching it on today’s balance sheet needs ¥926 B against the ¥900 B just earned, or ¥171 B less equity — and the plan commits ¥300 B of buybacks, which is 176% of that reduction.
The house, which is also the company
Itochu dates itself from 1858, which makes it twelve years older than Mitsubishi’s house and the oldest of the five. The difference that matters is not the twelve years, though. It is that for Itochu those are the same company.
Mitsubishi, Mitsui and Sumitomo were zaibatsu. The occupation authorities dissolved them in 1947, and the companies trading under those names today are post-war re-mergers of the pieces — which is why the Mitsubishi page has to give 1870 and 1954 as two different answers to one question. Itochu was never a zaibatsu. It was a trading firm, it was not broken up, and 1858 is the only date it has.
What grew out of that single date is a group of more than 260 companies employing more than 110,000 people on a consolidated basis — against about 4,000 at the parent itself. The ratio is the shape of the business: Itochu the listed company is a small organisation that owns a very large one, which is why every figure on this page is a consolidated figure and why the segment note is the only window into what is actually being run.
Where the return actually comes from
Return on equity is the headline number for all five of these houses and it is the one most easily manufactured. A company can raise it by earning more on what it owns, or by owning less relative to what it borrows. The two are not the same thing and only one of them is a business result.
They separate exactly. Return on equity is return on assets multiplied by leverage — average assets over average equity — and because both sides are struck on average balances the identity closes to the decimal. For the year ended 31 March 2026:
| House | Return on average assets | Leverage | Return on average equity |
|---|---|---|---|
| Itochu | 5.7% | 2.6× | 14.6% |
| Mitsubishi | 3.5% | 2.4× | 8.5% |
The leverage is all but identical — 2.6× against 2.4×, a difference of 0.2 of a turn. Whatever is producing a return on equity of 14.6% here and 8.5% there, it is not that one of these companies is carrying more debt against its equity than the other. On the asset side the two are 1.6× apart.
Nor is it one good year. Itochu earns a higher return on assets than Mitsubishi in every year of the record for which an opening balance sheet exists — nine of the ten — and the gap is widest in the worst years. In the year to March 2021 Itochu earned 3.6% on assets and Mitsubishi 0.9%.
There is a second fact inside the same series, and it cuts the other way. Itochu’s leverage has fallen for most of the decade — from 3.3× in the year to March 2018 to 2.6× now — because equity has compounded faster than the balance sheet. Equity went from ¥2.4 tn to ¥6.6 tn while total assets went from ¥8.1 tn to ¥16.7 tn. Holding a return on equity near 15% through that is harder than holding it at constant leverage, and it is the reason the latest year’s 14.6% is one of the two lowest readings in the series rather than a sign of anything breaking.
The segments, and the capital each one carries
Itochu reports eight business segments and one combined row. Three years are shown rather than ten for the same reason as on the Mitsubishi page: segment definitions move, and splicing two sets of them would produce a series nobody reports.
The combined row is treated here as a segment rather than as an adjustment, and that is a judgement worth stating. Mitsubishi’s adjustments line carries a negative asset balance, which is what an elimination looks like, and including it in a denominator produces shares that sum to more than the whole. Itochu’s combined row carries ¥2.0 tn of positive assets and 22.0% of the profit. Excluding it would hide the largest line in the table.
| Segment | 2024 | 2025 | 2026 | Change |
|---|---|---|---|---|
| Machinery | 131.6 | 136.5 | 155.6 | 24.0 |
| Metals & Minerals | 226.1 | 178.4 | 143.5 | (82.6) |
| ICT & Financial Business | 67.8 | 83.2 | 93.0 | 25.3 |
| Food | 66.3 | 85.1 | 92.1 | 25.8 |
| Energy & Chemicals | 91.7 | 78.6 | 69.3 | (22.4) |
| General Products & Realty | 66.2 | 69.7 | 60.8 | (5.3) |
| The 8th | 35.8 | 65.1 | 45.0 | 9.2 |
| Textile | 27.0 | 73.8 | 43.3 | 16.3 |
| Others, adjustments and eliminations | 89.4 | 109.9 | 197.6 | 108.2 |
| Group | 801.8 | 880.3 | 900.3 | 98.5 |
No segment lost money in any of the three years, which is not true of Mitsubishi and is the clearest single expression of what a non-resource weighting does to the shape of a trading house’s earnings.
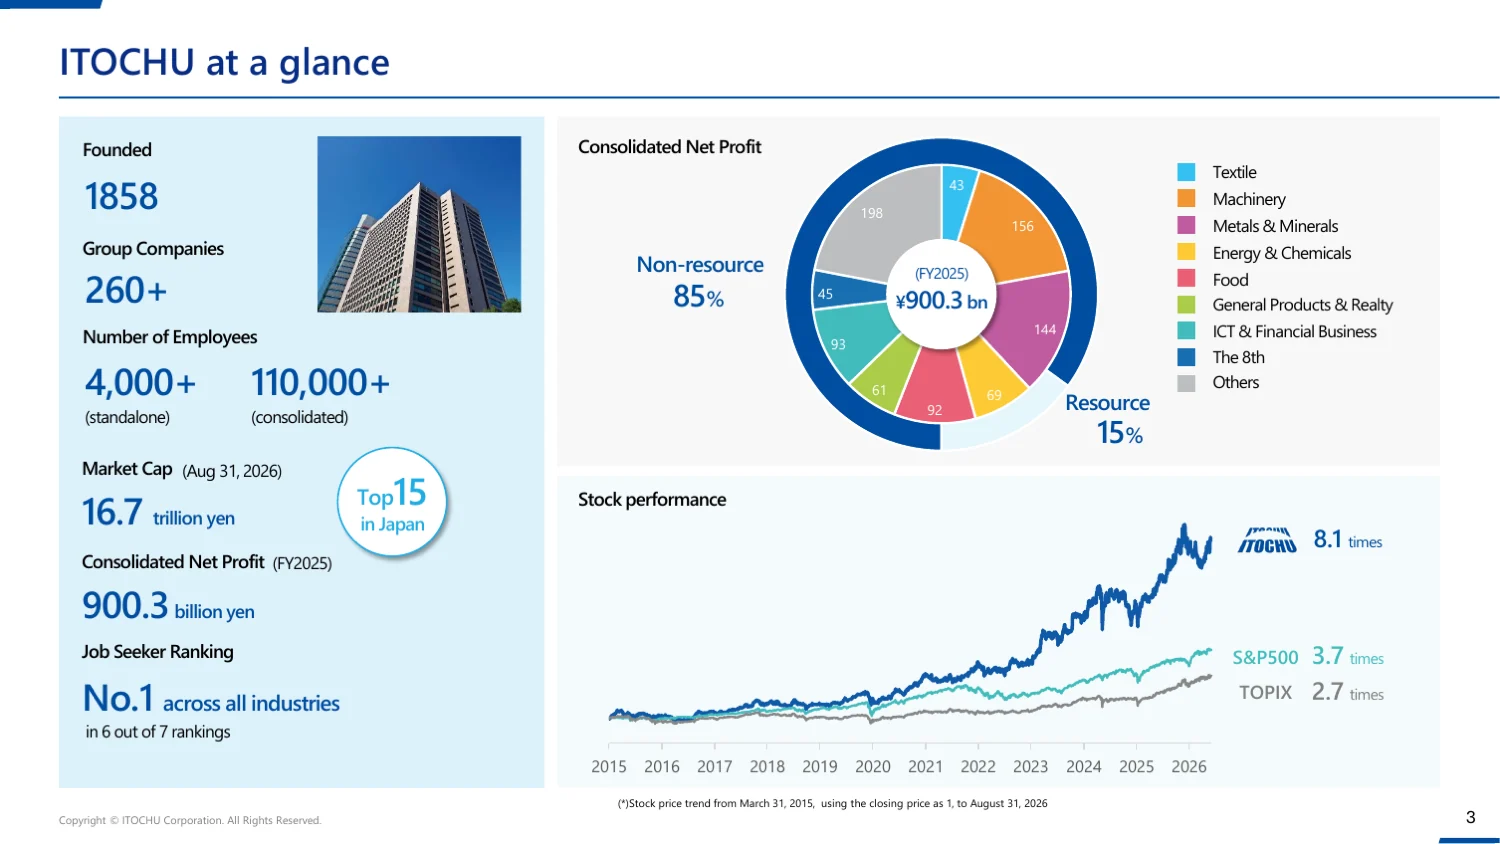
That is the company’s own picture of the first column of the table above, and the two are worth putting side by side. The figures on this page are not taken from the slide — they come from the segment note in the accounts — but every one of the nine rounds to what the slide shows, and so does the ¥900.3 B total. It is the cheapest check a reader can make on whether this page is reading the filings correctly.
One figure on it needs reconciling rather than confirming. The slide puts non-resource businesses at 85% of profit; the chapter below says 80%. Both are Itochu’s own and they are different windows — the latest year alone against the three-year average published later in the same deck.
Share of profit against share of assets
The question that matters for a conglomerate is not which segment is biggest but which ones earn more than their size. Set each segment’s share of group profit against its share of group assets and the carried are separated from the carriers.
A reader coming from the Mitsubishi page will expect this chart to be flatter. It is not. Setting the combined row aside, Itochu’s named businesses run from 5.2 points down to 8.1 points below their size — a span of 13.4 points — against 13.2 points at Mitsubishi. The internal dispersion of the two houses is the same to within a fifth of a point, and the ratio of best segment return to worst is about four to one at both.
What differs is not the shape but where the whole distribution sits. Mitsubishi’s best segment earns 4.8% on the assets it carries. Four of Itochu’s eight named segments beat that, and Mitsubishi’s best would rank fifth here. Itochu is not better at allocating between its businesses than Mitsubishi is — it is in better businesses.
| Segment | Net income | Total assets | Share of profit | Share of assets | Spread, points | Return on assets |
|---|---|---|---|---|---|---|
| Others, adjustments and eliminations | 197.6 | 1,958 | 22.0% | 11.7% | 10.2 | 10.1% |
| Metals & Minerals | 143.5 | 1,793 | 15.9% | 10.7% | 5.2 | 8.0% |
| Machinery | 155.6 | 2,603 | 17.3% | 15.6% | 1.7 | 6.0% |
| ICT & Financial Business | 93.0 | 1,577 | 10.3% | 9.4% | 0.9 | 5.9% |
| Textile | 43.3 | 752 | 4.8% | 4.5% | 0.3 | 5.8% |
| Food | 92.1 | 2,403 | 10.2% | 14.4% | (4.1) | 3.8% |
| Energy & Chemicals | 69.3 | 1,819 | 7.7% | 10.9% | (3.2) | 3.8% |
| General Products & Realty | 60.8 | 1,629 | 6.8% | 9.7% | (3.0) | 3.7% |
| The 8th | 45.0 | 2,197 | 5.0% | 13.1% | (8.1) | 2.0% |
The best line and the worst line
The combined row earns the most and explains the least
“Others, adjustments and eliminations” earned ¥197.6 B in the year to March 2026, up from ¥89.4 B two years earlier. That is 22.0% of the group’s profit and a return of 10.1% on the ¥2.0 tn the row carries — the highest return of any line in the table, by a margin of 2.0896468898515126 points over the next best.
It is also the only line in the table that is not a description of a business. The segment disclosure names what the other eight do; this one is a residual with three different kinds of thing inside it — corporate items, businesses that do not sit in a named segment, and the eliminations between segments — reported as one number. A fifth of the profit of a ¥13.8 tn company is arriving through it, at the best rate in the group, and a reader cannot tell from the accounts what produced it.
This is the mirror image of the disclosure problem on the Mitsubishi page. There, 76.2% of a ¥5.2 tn equity-method book is not attributed to any named company. Here, a fifth of the profit is not attributed to any named business. Both houses disclose their segments carefully and then leave their best returns in a bucket.
The 8th, and what FamilyMart costs
At the other end, The 8th — the consumer group built around FamilyMart, created as an eighth business company in 2019 — earned ¥45.0 B on ¥2.2 tn. That is 2.0%, the lowest in the table, and 5.0% of the profit on 13.1% of the assets — a shortfall of 8.1 points, the widest of the nine.
It is worth being careful about what that does and does not say. A convenience store chain is a consolidated, asset-heavy, low-margin business, and a trading house that buys one is choosing to put a large amount of capital behind a thin return in exchange for a position in Japanese consumer distribution. The segment is not failing — its profit rose from ¥35.8 B to ¥45.0 B across the three years, and its gross profit is the second largest of any segment at ¥450.5 B. What the table says is narrower and harder: 13.1% of Itochu’s balance sheet is working at 2.0%, and the company’s overall 5.7% is achieved in spite of it.
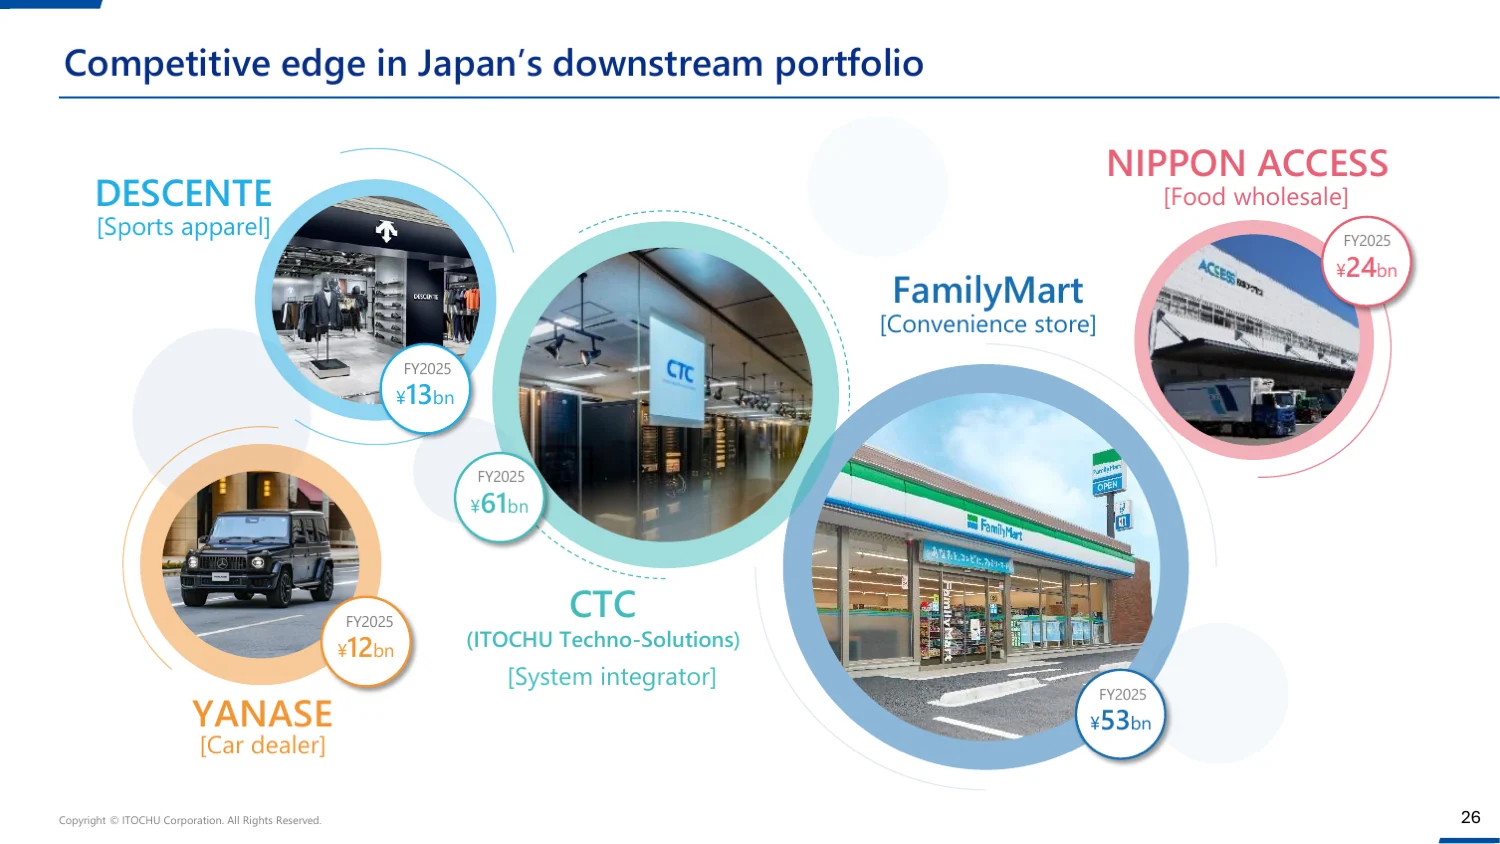
This is the only place in Itochu’s published materials where an individual subsidiary is named with a number attached, and two of the numbers are larger than they look. FamilyMart earned ¥53 B. The whole of The 8th reported ¥45.0 B in the same year. CTC, the system integrator, earned ¥61 B against ¥93.0 B for all of ICT & Financial Business.
Those are comparisons, not attributions, and the distinction matters. The slide does not say which segment any of these companies reports into, and this page is not going to assume it — a subsidiary’s profit and a segment’s profit are struck differently in any case. What the magnitudes establish is narrower and still worth having: single companies out of more than 260 are earning sums of the same order as entire segments, and not one of them is identified anywhere in the segment note. Whatever is inside The 8th’s ¥2.2 tn of assets, it is not evenly productive.
| Company | What it is | Net profit |
|---|---|---|
| CTC (ITOCHU Techno-Solutions) | System integrator | 61 |
| FamilyMart | Convenience stores | 53 |
| NIPPON ACCESS | Food wholesale | 24 |
| DESCENTE | Sports apparel | 13 |
| YANASE | Car dealer | 12 |
How much of the profit it controls
35.9% of the latest year’s net income arrived as equity-method income — ¥323.5 B out of ¥900.3 B — from companies Itochu holds a stake in but does not consolidate. Across the record the share has run from 19.6% to 57.0%.
That is a large number in isolation and a small one in context. The same measure at Mitsubishi is 58.5%. The difference is structural rather than a matter of degree: Itochu consolidates most of what it earns, so its revenue, its gross profit and its balance sheet describe the same businesses that produce its profit. An earnings multiple on Itochu is measuring something much closer to the earnings it controls.
The non-resource weighting
Itochu organises its own account of itself around one structural fact: most of what it earns does not come from commodities. On the company’s own figures, averaged over the three fiscal years to March 2026, non-resource businesses produced 80% of profit and held 90% of assets, against average profit of ¥861 billion and average assets of ¥15,452 billion.
The segment table is consistent with it. Metals & Minerals — the one resource-weighted segment — holds 10.7% of the assets and earned 15.9% of the profit, and its contribution has fallen in each of the three years, from ¥226.1 B to ¥143.5 B, while its assets rose ¥390 B. A house with Mitsubishi’s resource weighting would have had a materially worse three years than Itochu did on the same commodity prices.
The cost of that weighting is visible on the other side of the ledger. The resource segment is still the second-best return in the table at 8.0%, and in the years when commodity prices run, the houses that carry more of them earn more. Itochu’s five-year total return is the lowest of the five houses for exactly that reason. Stability and upside are being traded against each other here, and the trade is deliberate.
And where it all sits
The other half of the portfolio question is geography, and this page has no data of its own on it: the segment note splits by business, not by region. Itochu publishes the split, so the slide below is the source rather than an illustration of something computed above.
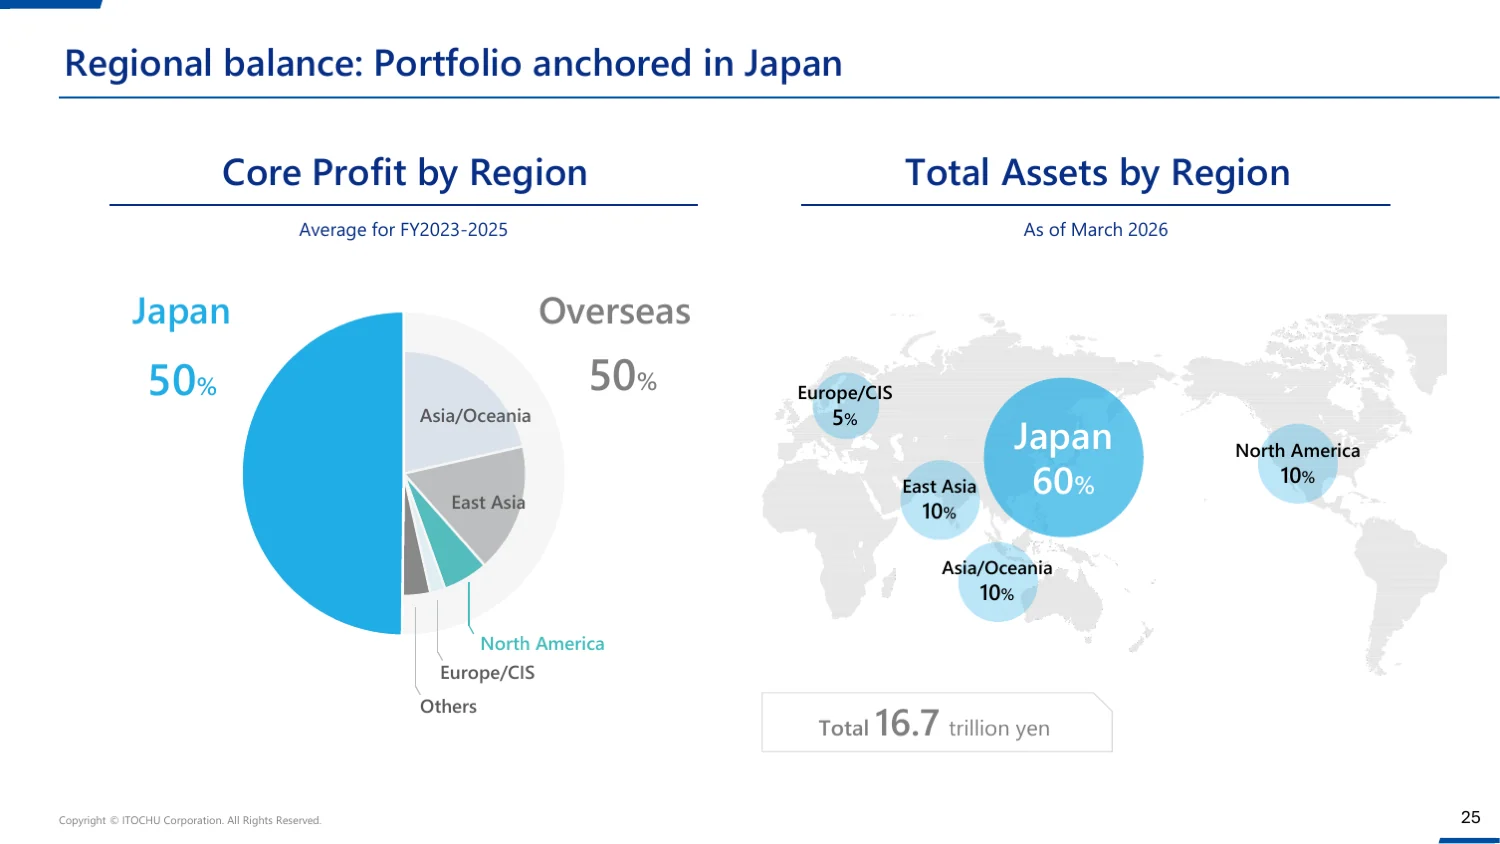
Half the profit and three fifths of the assets are in Japan. For a “general trading company” whose business is usually described as moving commodities between countries, that is the wrong way round — and it is the structural reason the non-resource weighting is available at all. The businesses carrying it are Japanese consumer businesses, and they are the ones named two chapters above.
Berkshire’s stake, as Itochu tells it
Berkshire Hathaway held 10.1% of Itochu at December 2025, and the dated series behind that figure is something only Itochu publishes. Berkshire discloses crossings, not a running percentage; the Japanese companies publish the percentage. The chart below is Itochu’s own, reproduced as published.
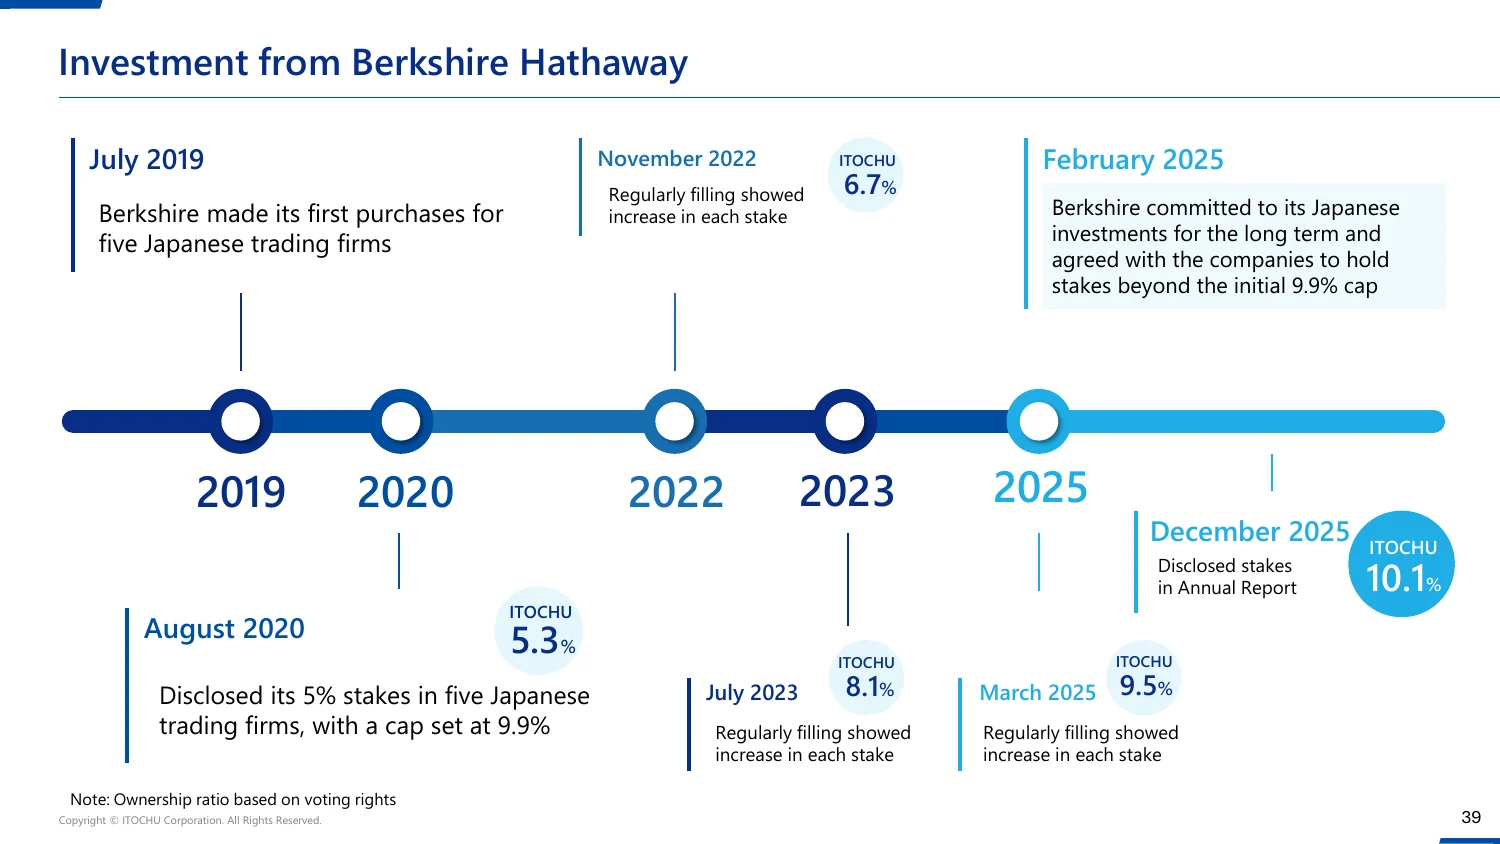
Two things in it are worth drawing out. The first is the February 2025 agreement: Berkshire’s original disclosure in August 2020 came with a stated ceiling of 9.9%, and the five houses agreed to let it pass that ceiling in exchange for a long-term commitment. The 10.1% now held is on the other side of a door the companies themselves opened.
The second is that this is not only a financial position. Itochu does business with three Berkshire subsidiaries, which it also sets out.
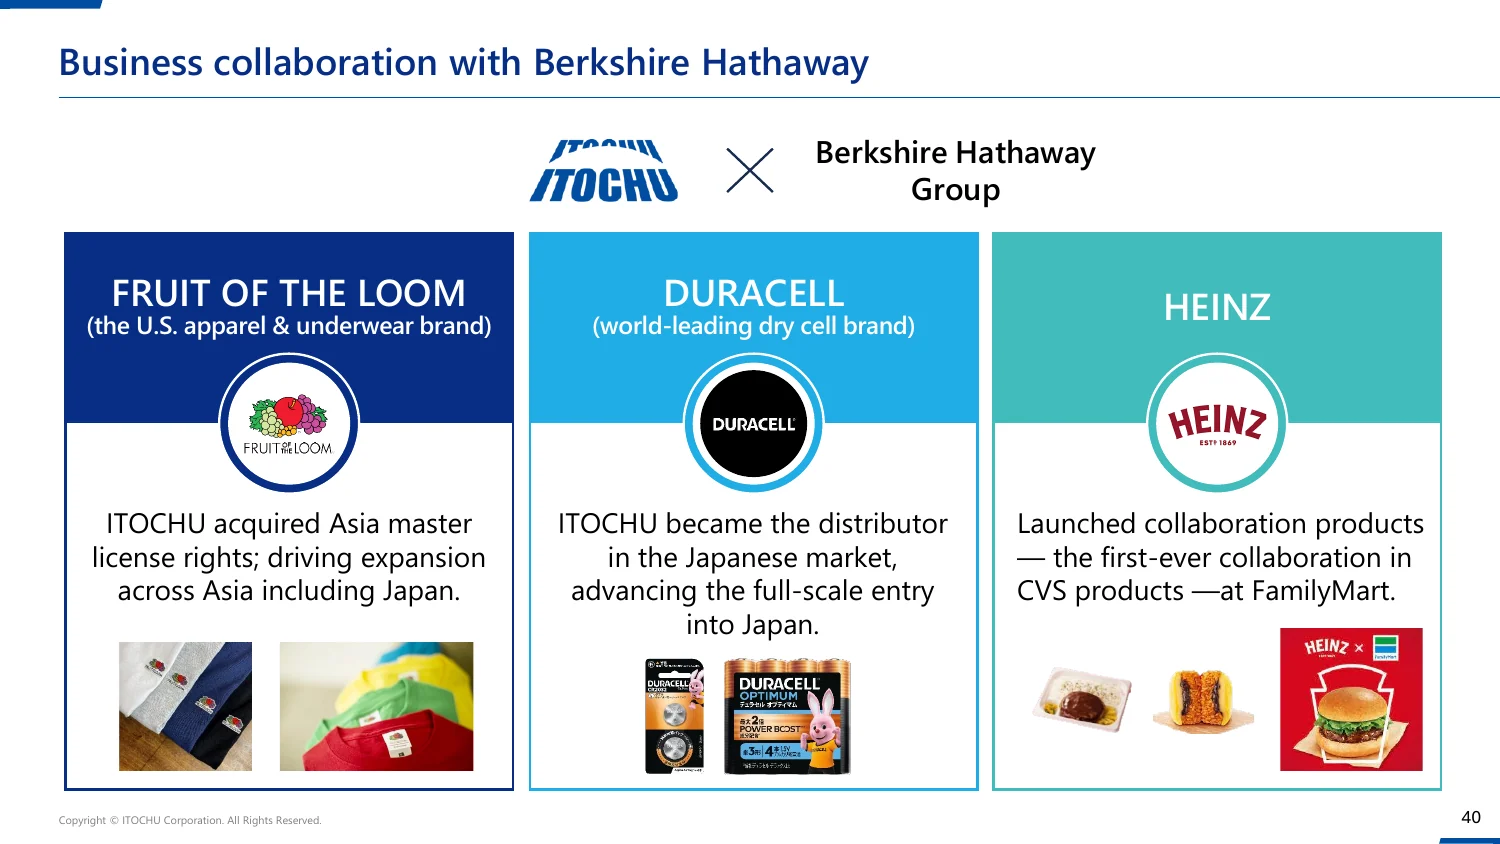
| Berkshire business | The arrangement |
|---|---|
| Fruit of the Loom | Itochu acquired the Asia master licence and is expanding the brand across Asia, Japan included. |
| Duracell | Itochu became the distributor in Japan, taking the brand to full-scale entry. |
| Heinz | Collaboration products at FamilyMart — the first such tie-up in convenience-store products. |
None of these is large enough to matter to either company’s earnings, and this page is not going to pretend otherwise. What they are is evidence about the nature of the holding. A passive stake does not come with an Asia master licence attached.
Ten years of assets, equity and earnings
Every column below is struck from the same filings as the rest of the page. Return on assets and leverage are both on average balances, so they multiply back to return on equity exactly — and both are blank in the first year, which has no opening balance sheet to average against.
| Year | Total assets | Equity | Net income | Equity-method income | Return on assets | Leverage | Return on equity | Book value per share | Price to book |
|---|---|---|---|---|---|---|---|---|---|
| 2017 | 8,122 | 2,402 | 352.2 | 185.2 | — | — | 15.3% | 307 | 1.0× |
| 2018 | 8,664 | 2,669 | 400.3 | 216.2 | 4.8% | 3.3× | 15.8% | 344 | 1.2× |
| 2019 | 10,099 | 2,937 | 500.5 | 98.1 | 5.3% | 3.3× | 17.9% | 386 | 1.0× |
| 2020 | 10,920 | 2,996 | 501.3 | 205.9 | 4.8% | 3.5× | 16.9% | 402 | 1.1× |
| 2021 | 11,178 | 3,316 | 401.4 | 228.6 | 3.6% | 3.5× | 12.7% | 447 | 1.6× |
| 2022 | 12,154 | 4,199 | 820.3 | 291.4 | 7.0% | 3.1× | 21.8% | 572 | 1.5× |
| 2023 | 13,115 | 4,823 | 800.5 | 320.7 | 6.3% | 2.8× | 17.7% | 663 | 1.3× |
| 2024 | 14,490 | 5,427 | 801.8 | 316.3 | 5.8% | 2.7× | 15.6% | 754 | 1.7× |
| 2025 | 15,134 | 5,755 | 880.3 | 349.3 | 5.9% | 2.6× | 15.7% | 812 | 1.7× |
| 2026 | 16,733 | 6,590 | 900.3 | 323.5 | 5.7% | 2.6× | 14.6% | 943 | 2.1× |
Two readings deserve a note. Price to book has never been below 1.0× in the record and is 2.1× now, the highest in the series and the highest of the five houses — the market has never offered this company at a discount to its own accounts. And the share count has fallen from 7,836 million to 6,990 million, a reduction of 10.8%, which is the quietest of the four things that produced the shareholder’s return and the only one entirely within management’s control.
Ten years of segments
The segments behind the return on equity this page opens with, over ten years rather than three. Itochu broke out one new line in the middle of the decade and otherwise left its reporting alone, which makes most of the book followable across the period.
Itochu has re-cut its reporting segments once since 2017, at 2019. Matching segment names across a break like that splices two definitions together and calls the result a trend, so the eras are kept apart here and each figure says which basis it is on.
| Years | Segments | The basis |
|---|---|---|
| 2017–2018 | 8 | Eight segments. The basis before the consumer division was broken out on its own. |
| 2019–2026 | 9 | Nine segments, with The 8th broken out. ITOCHU separated its consumer-facing division — named The 8th for the company’s position among the trading houses it set out to overtake — into a reporting segment of its own, where FamilyMart sits. The other eight lines carry on, so this is an addition rather than a reshuffle. |
7 operating lines keep the same name throughout: Energy & Chemicals, Food, General Products & Realty, ICT & Financial Business, Machinery, Metals & Minerals and Textile. Even those are not strictly like for like across a re-cut, so read them as direction rather than as a precise series.
What the balance sheet holds now
The current basis, ranked by the assets each line carries against what it earns on them. 4 of the 8 earn less on their own assets than the group earns on all of its.
| Segment | Assets | Share | Profit | Return on assets |
|---|---|---|---|---|
| Machinery | 2,603 | 17.6% | 155.6 | 6.0% |
| Food | 2,403 | 16.3% | 92.1 | 3.8% |
| The 8th | 2,197 | 14.9% | 45.0 | 2.0% |
| Energy & Chemicals | 1,819 | 12.3% | 69.3 | 3.8% |
| Metals & Minerals | 1,793 | 12.1% | 143.5 | 8.0% |
| General Products & Realty | 1,629 | 11.0% | 60.8 | 3.7% |
| ICT & Financial Business | 1,577 | 10.7% | 93.0 | 5.9% |
| Textile | 752 | 5.1% | 43.3 | 5.8% |
Over the ten years total assets grew 106% and equity 174%, against profit 156%. Those three are continuous whatever the segments did, which is why the group figures carry the long view on this page and the segment tables carry the detail.
What management has committed to
The FY2026 Management Plan targets ¥950 B of net profit for the year ending 31 March 2027, a return on equity of 15%, and a net debt-to-equity ratio no higher than 0.6×. Shareholder returns are set at 64% of profit, with a dividend of ¥44 per share and ¥300 B of buybacks.
What distinguishes this plan from Mitsubishi’s is how little of it is aspiration. The return target is 0.4 points above the 14.6% just earned, and Itochu cleared 15% in 8 of the ten years in the record. The profit target of ¥950 B is 5.5% above the ¥900 B just earned, which was itself the best year in the series.
| Lever | Required | Today |
|---|---|---|
| Earn more on the same balance sheet | ¥926 B of net income | ¥900 B |
| Return on assets implied, at today’s leverage | 5.8% | 5.7% |
| Carry today’s earnings on less equity | ¥6.0 tn of average equity | ¥6.2 tn |
| Reduction that implies | ¥171 B | ¥300 B committed — 176% of it |
The second lever is the one that closes. ¥171 B of equity reduction would put return on equity at the target on today’s earnings, and the plan already commits ¥300 B of buybacks — 176% of what is needed. Mitsubishi’s equivalent arithmetic needs ¥2.7 tn against ¥1.0 tn committed, which covers 36.6% of it. The two companies are not attempting the same thing.
What this arithmetic assumes. That equity stays where it is. It will not — retained earnings add to it every year, and at a 64% payout roughly a third of profit stays in the company. The buyback has to run against that accumulation rather than against a standing balance, which is why the plan sets a profit target as well as a return target. The figures above size the gap; they do not forecast it closed.
Conventions
- Fiscal years. Every column is labelled by the date it ends. The year ended 31 March 2026 is FY2026 to the data vendors and FY2025 to Itochu itself; labelling by end date avoids choosing between them.
- Return on equity. Net income over average equity, where average equity is the mean of the opening and closing balances.
- Return on assets. Net income over average total assets, on the same basis. Both are averages so that return on equity decomposes exactly into return on assets times leverage.
- Leverage. Average total assets over average equity. It is a balance sheet ratio, not a measure of net debt; the plan’s 0.6× ceiling is a net debt-to-equity figure and the two are not interchangeable.
- Segment returns. Segment net income over segment total assets, as reported, with no allocation of corporate items.
- Currency. Yen throughout. Where a dollar figure appears on this section’s other pages it is converted at the single rate named in the dataset, and no figure on this page needs it.
Follow the research
New valuations and research notes, a few times a year. No promotional email, no sharing of your address, unsubscribe in one click.
Delivered by Buttondown. You can also subscribe by RSS.