
Ten years, ten businesses, and one return that never moved
Sumitomo earns a better return on equity than two houses the market values more highly, and trades at the lowest multiple of book of the five. Ten years of its own accounts say why: a balance sheet that grew faster than the return on it, reported through segments the company has re-cut twice.
A company that puts a quarter more capital to work and earns the same rate on it has grown without compounding. Sumitomo is the only one of the five that publishes the number showing it.
- 1 It is 9 businesses, and no engine. The operating segments carry ¥13.4 tn between them, spread across copper and coal, power, steel, cars, property, media, chemicals and construction equipment. 4 of them — holding 42.6% of the balance sheet — earn less on their own assets than the group earns on all of its.
- 2 The balance sheet grew. The return on it did not. Over the ten years total assets rose 75.7% and equity 95.6%. Sumitomo’s own return on invested capital was 8.0% under SHIFT 2023, is 8.0% now and is forecast at 8.0% again — while invested capital rose 23.7%.
- 3 The segments have been re-cut twice, so there is no ten-year series. Three reporting bases since 2017, changing at 2018 and 2024. Only 3 operating names run the whole decade. This page keeps the eras apart rather than splicing three definitions into one line.
- 4 Cheapest of the five — and less cheap than it looks. At 1.5× book and 11.5× earnings it is the lowest of the group on both. On the company’s own underlying profit, which strips 12.0% of the headline, those become 13.1× earnings and 11.4% on equity.
The cheapest of the five
Across the five houses the market pays between 1.5× and 2.1× book value. Sumitomo is at the bottom of that range, and the ordering does not follow the returns.
| House | Return on average equity | Price to book | Price to earnings |
|---|---|---|---|
| Itochu | 14.6% | 2.1× | 15.3× |
| Marubeni | 13.6% | 2.1× | 17.0× |
| Sumitomo | 12.9% | 1.5× | 11.5× |
| Mitsui | 10.2% | 1.9× | 20.2× |
| Mitsubishi | 8.5% | 2.1× | 24.3× |
Mitsubishi earns 8.5% on equity and trades at 2.1× book. Mitsui earns 10.2% and trades at 1.9×. Sumitomo earns 12.9% — more than either — and trades at 1.5×. On the most common single measure of quality, the market has the order wrong, or it is pricing something the measure does not contain.
This is not a new observation, and it is not this page’s. The Tokyo Stock Exchange asked listed companies to publish an account of how they manage against their cost of capital and their share price. Sumitomo is the only one of the five houses on this site with such a disclosure, and in it the company charts its own price-to-book ratio.
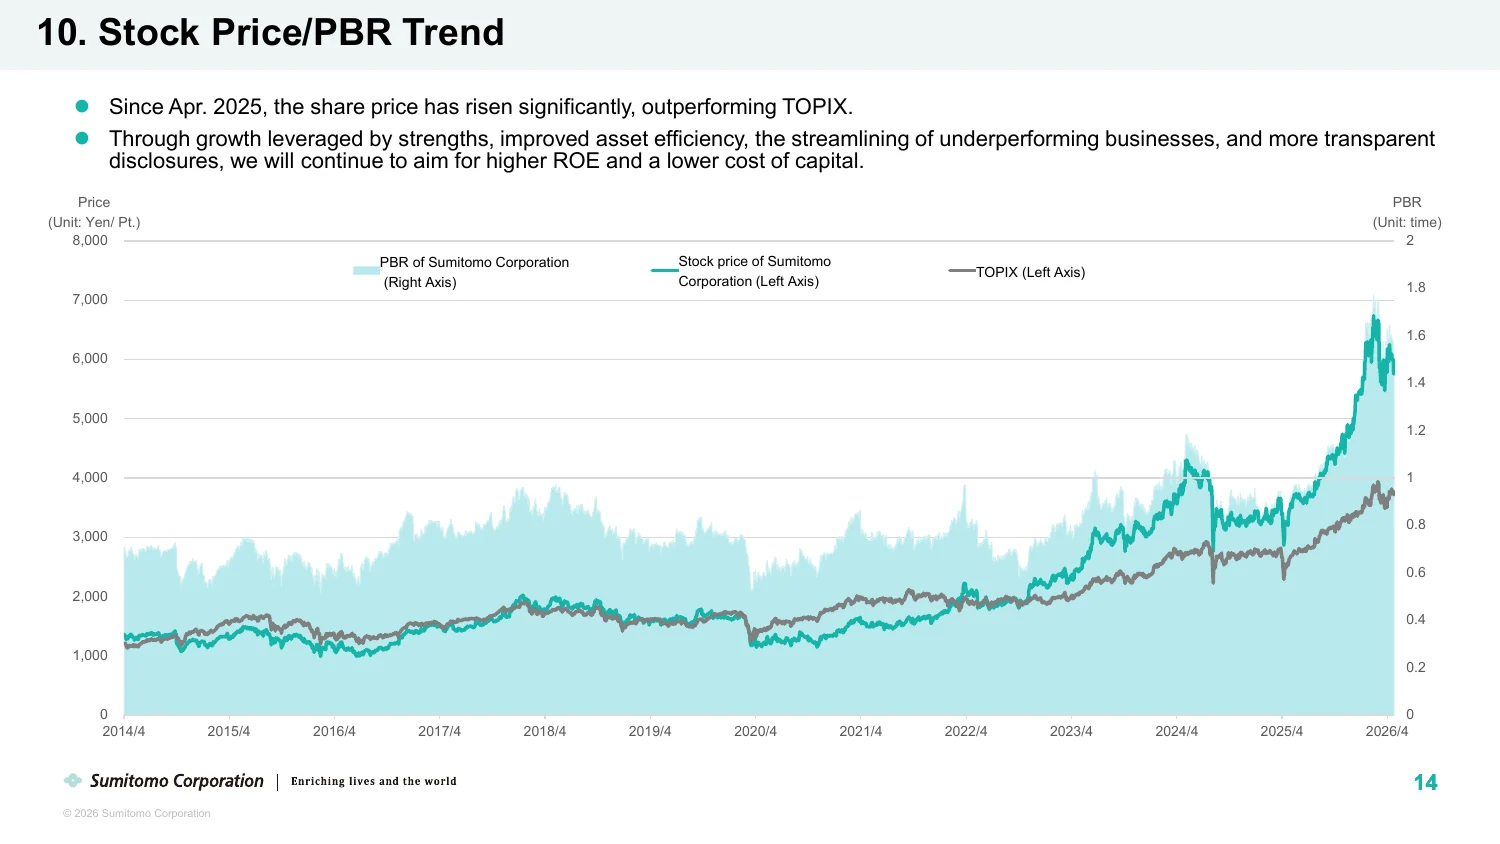
The company’s stated answer is a threshold: it says that “consistently achieve an ROE of 12% or higher” would put profitability above the cost of capital. That is a floor, not a target, and on the ten-year record it has been cleared in 6 of the ten years. The latest year clears it. So does the one before.
At 1.5× the shares are at the highest multiple of book in this ten-year record — the range runs from 0.6× — so whatever the discount is, it has been narrowing. The question the rest of this page is about is what is left of it, and the company publishes two numbers that bear on it directly.
What Sumitomo actually owns
Before the discount is worth arguing about, it is worth saying what is being discounted. Sumitomo reports in 9 operating segments and they are not variations on a theme: a copper and coal book, a power and renewables book, a steel distributor, a car finance and dealership business, a property arm, a cable and media holding, a chemicals distributor, a leasing and construction-equipment business. Between them they carry ¥13.4 tn of assets.
The shape of the company is in the gap between two columns. Each segment holds a share of the balance sheet and earns a share of the profit, and at Sumitomo those two orderings disagree more than at any other house in this section. Mineral Resources is the largest single line at 18.4% of operating assets; it earned 3.3% on them last year.
| Segment | Assets | Share | Profit | Return on assets |
|---|---|---|---|---|
| Mineral Resources | 2,464 | 18.4% | 82.3 | 3.3% |
| Energy Transformation | 1,978 | 14.7% | 102.4 | 5.2% |
| Transportation & Construction | 1,875 | 14.0% | 88.9 | 4.7% |
| Diverse Urban Development | 1,793 | 13.4% | 81.5 | 4.5% |
| Media & Digital | 1,493 | 11.1% | 51.2 | 3.4% |
| Steel | 1,200 | 8.9% | 74.3 | 6.2% |
| Chemical Solutions | 943 | 7.0% | 26.5 | 2.8% |
| Automotive | 862 | 6.4% | 63.2 | 7.3% |
| Lifestyle Business | 820 | 6.1% | (3.6) | -0.4% |
4 of the 9 earn less on their own assets than the group earns on all of its, and they are not small: they hold ¥5.7 tn between them, or 42.6% of the operating balance sheet. That is the fact the rest of this page is about. It is not that Sumitomo owns bad businesses; it is that it owns a great many medium ones, and no single line big enough and profitable enough to carry the average the way iron ore carries Mitsui or the consumer franchise carries Itochu.
A trading house the occupation created
Mitsui’s page records a company broken into two hundred pieces by the post-war dissolution of the zaibatsu. Sumitomo’s trading house is the same event from the other side: it exists because of the dissolution, not in spite of it.
| Year | What happened |
|---|---|
| 1691 | The Sumitomo family opens the Besshi copper mine under licence from the Tokugawa shogunate. It runs for 283 years and is the origin of the igeta well-frame mark the company still uses. |
| 1919 | The Osaka North Harbour Co. is founded by Sumitomo and others. It is a land and building business, not a trading house. |
| 1945 | Anticipating the occupation’s order to dissolve the zaibatsu, the company is renamed Nippon Engineering and moves into trading. The trading house exists because of the dissolution, not in spite of it. |
| 1952 | Renamed Sumitomo Shoji Kaisha, Ltd., and a subsidiary opens in New York. |
The company that trades today was a land and building business in 1919 and became a trading house in 1945 because its management expected the occupation to break up the group it belonged to. The igeta mark on the door is 335 years older than the company underneath it.
Ten years of assets, equity and earnings
Return on assets and leverage are both struck on average balances, so they multiply back to return on equity exactly. Both are blank in the first year, which has no opening balance sheet to average against; the affiliate share is blank in the loss year, where a share of a negative number means nothing.
| Year | Total assets | Equity | Net profit | Affiliate profit | From affiliates | Return on assets | Leverage | Return on equity | Book value per share | Price to book |
|---|---|---|---|---|---|---|---|---|---|---|
| 2017 | 7,762 | 2,366 | 170.9 | 83.5 | 49% | — | — | 7.4% | 474 | 0.8× |
| 2018 | 7,771 | 2,558 | 308.5 | 149.7 | 49% | 4.0% | 3.2× | 12.5% | 512 | 0.9× |
| 2019 | 7,917 | 2,771 | 320.5 | 127.1 | 40% | 4.1% | 2.9× | 12.0% | 555 | 0.7× |
| 2020 | 8,129 | 2,544 | 171.4 | 84.8 | 49% | 2.1% | 3.0× | 6.4% | 509 | 0.6× |
| 2021 | 8,080 | 2,528 | (153.1) | (41.4) | — | -1.9% | 3.2× | -6.0% | 506 | 0.8× |
| 2022 | 9,582 | 3,198 | 463.7 | 176.8 | 38% | 5.3% | 3.1× | 16.2% | 640 | 0.8× |
| 2023 | 10,105 | 3,779 | 565.3 | 252.4 | 45% | 5.7% | 2.8× | 16.2% | 765 | 0.8× |
| 2024 | 11,033 | 4,445 | 386.4 | 172.4 | 45% | 3.7% | 2.6× | 9.4% | 910 | 1.0× |
| 2025 | 11,631 | 4,648 | 561.9 | 277.0 | 49% | 5.0% | 2.5× | 12.4% | 960 | 0.9× |
| 2026 | 13,638 | 4,629 | 600.3 | 266.7 | 44% | 4.8% | 2.7× | 12.9% | 970 | 1.5× |
The year ended March 2021 is the hole in the record: a loss of ¥153.1 B and a return on equity of -6.0%, with affiliate income itself negative at (¥41.4 B). Every average on this page that spans it is dragged by it, which is why this page quotes the range and the count of years rather than a ten-year mean. 6 of the ten cleared the 12% threshold the company now sets.
The share count has fallen 4.5% over the ten years, the least of the five — Mitsubishi has retired 23.0% and Mitsui 19.7%. The dividend has gone from ¥12.5 to ¥37.5 a share on the post-split basis this table uses.
Ten years of segments, in three different shapes
There is no ten-year segment series for this company, and the reason is itself a finding. Sumitomo has re-cut its reporting segments twice in the decade — at the year ended March 2018 and again at the year ended March 2024. Matching names across those breaks would splice three different definitions together and call the result a trend, so this page keeps them apart and says which basis each figure is on.
| Years | Segments | The basis |
|---|---|---|
| 2017 | 7 | Seven segments, with overseas arms reported apart. The last year on a basis that carried a separate “Overseas Subsidiaries and Branches” line — a geographic catch-all holding business the product segments would otherwise have shown, which is why no product line here is comparable with the same name a year later. |
| 2018–2023 | 7 | Seven segments, on product lines. The basis that ran for six years. Infrastructure, Lifestyle and Media & Digital are the names that disappear in the 2024 re-cut. |
| 2024–2026 | 10 | Ten segments, the current basis. Seven lines became ten. Energy Transformation, Diverse Urban Development, Automotive and Chemical Solutions appear for the first time; Infrastructure disappears into them. |
A company that re-cuts its segments twice in ten years is telling you something. It is not misconduct and it is not unusual in Japan; it is what a portfolio being rearranged looks like in the accounts. The practical cost to an outside reader is exactly the thing this section exists to provide — you cannot watch one business compound across the decade, because the company stopped reporting it as one business twice.
Three operating names survive all ten years: Mineral Resources, Steel and Transportation & Construction. Even these are not strictly like for like, because the 2018 re-cut folded the overseas subsidiaries into them. Read as direction rather than as a precise series, they are the longest view of this company's operations available.
The ten-year group record underneath those re-cuts is continuous, and it is the series that matters: total assets grew 75.7% and equity 95.6% over the decade. Profit grew faster than either, 251%, but from a 2017 base that was itself depressed — which is why the next chapter asks what the capital earns rather than what the profit did.
The number none of the other four publish
Return on equity is a geared measure. It rises if the business improves, and it rises if the balance sheet carries more debt against the same equity. The way to tell those apart is a whole-capital return, and Sumitomo is the only one of the five that publishes one by segment, with the capital beside it.
Its definition, from the slide: profit for the year including non-controlling interests, less interest expense after tax, over the average of opening and closing interest-bearing liabilities, lease liabilities and total equity. Because the denominator includes the debt, the figure sits below return on equity by construction. The gap between them is the gearing.
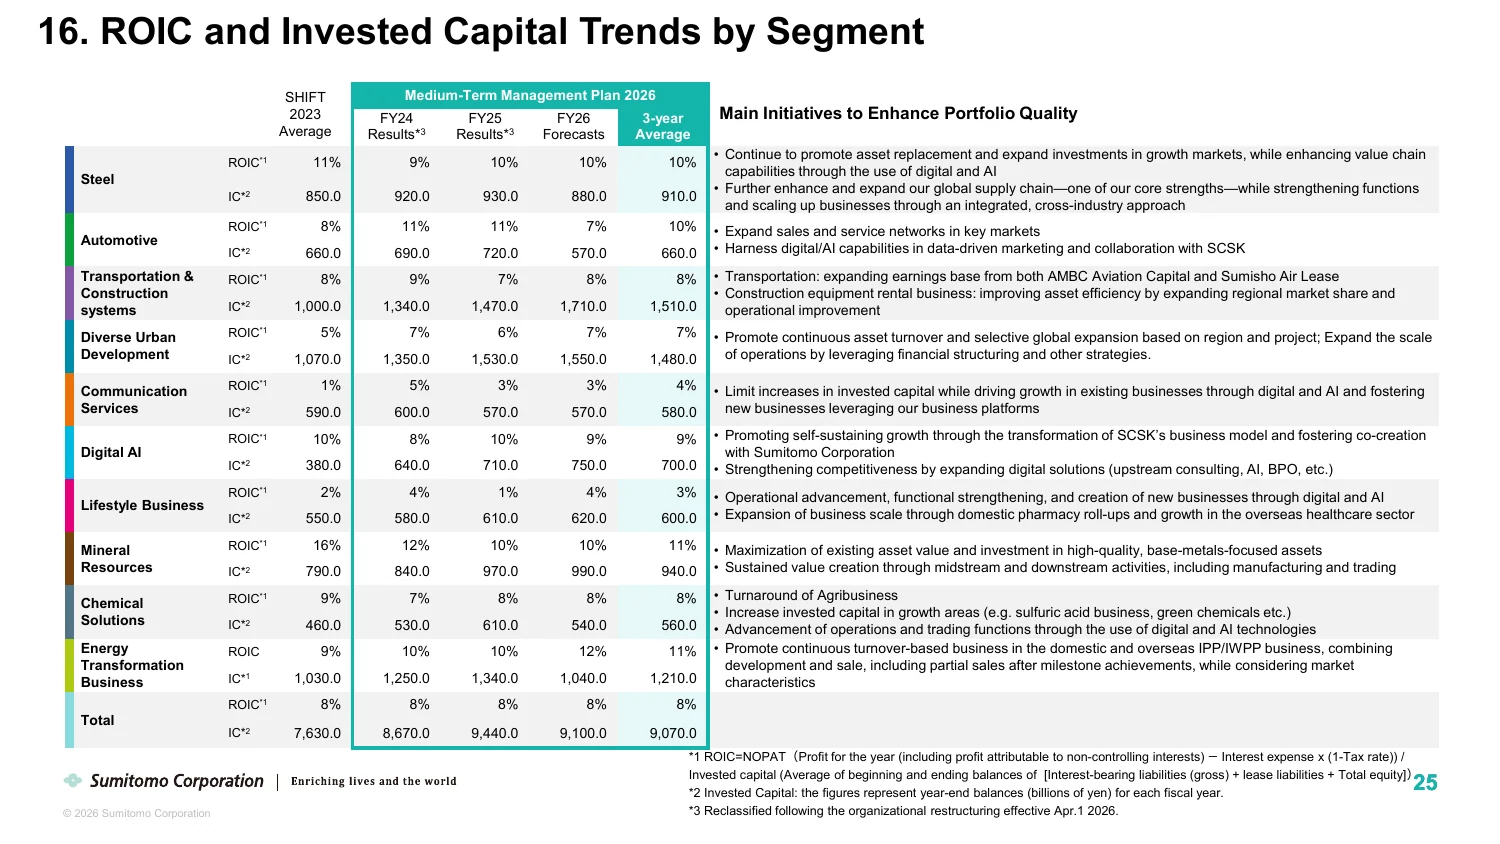
| Segment | SHIFT 2023 average | 2025 | 2026 | 2027 forecast | Invested capital, 2026 |
|---|---|---|---|---|---|
| Mineral Resources | 16% | 12% | 10% | 10% | 970 |
| Energy Transformation Business | 9% | 10% | 10% | 12% | 1,340 |
| Steel | 11% | 9% | 10% | 10% | 930 |
| Automotive | 8% | 11% | 11% | 7% | 720 |
| Digital AI | 10% | 8% | 10% | 9% | 710 |
| Transportation & Construction Systems | 8% | 9% | 7% | 8% | 1,470 |
| Chemical Solutions | 9% | 7% | 8% | 8% | 610 |
| Diverse Urban Development | 5% | 7% | 6% | 7% | 1,530 |
| Communication Services | 1% | 5% | 3% | 3% | 570 |
| Lifestyle Business | 2% | 4% | 1% | 4% | 610 |
| Total | 8% | 8% | 8% | 8% | 9,440 |
The invested-capital table splits Media & Digital into Communication Services and Digital AI. The segment panel does not, so the two tables have ten rows each but not the same ten.
Read the bottom row across. 8% under the previous plan, 8% and 8% in the two completed years of this one, 8% forecast for the next. Four columns, one number. Over the same stretch invested capital went from ¥7.6 tn to ¥9.4 tn, a rise of 24%.
Return on equity over those same years went from 9.4% to 12.4% to 12.9%. So the measure that includes the debt is flat and the measure that excludes it is rising. That is the arithmetic definition of a return improving because of the balance sheet rather than because of the businesses, and Sumitomo has published both halves of it.
The segment rows say where the capital sits. Lifestyle Business earns 1% on ¥610 B and Communication Services 3% on ¥570 B — ¥1.2 tn between them, about 13% of the group’s invested capital, earning almost nothing on it. Move those two to the group average and the group return would be materially higher without a single new investment.
What the year earned without the one-offs
The second number. Sumitomo reports, for every segment, the asset replacement and extraordinary gains and losses inside the result and the underlying profit left when they come out.
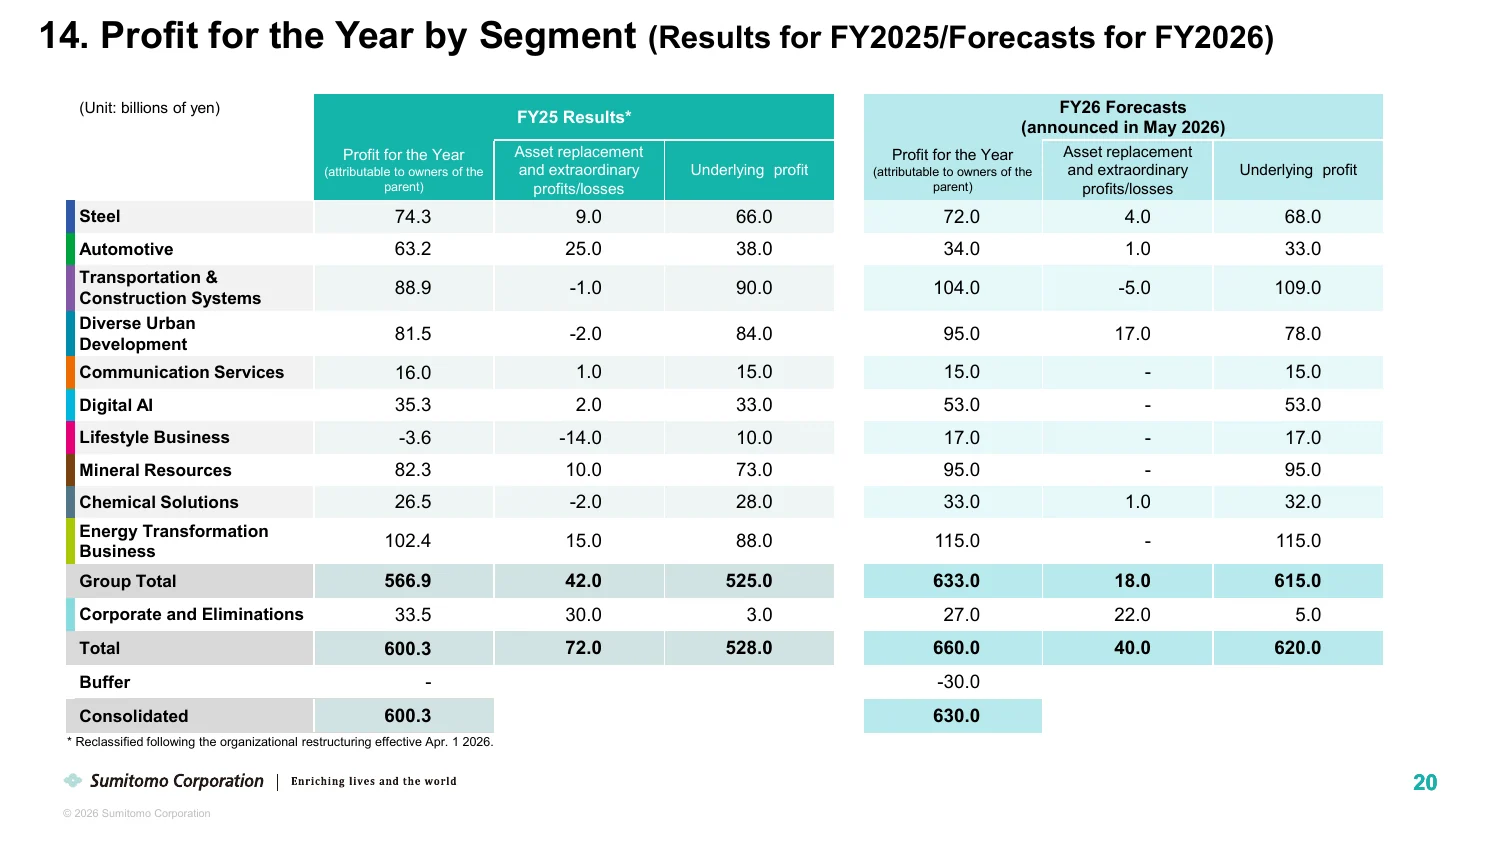
| Segment | Reported | Asset replacement and extraordinary | Underlying |
|---|---|---|---|
| Energy Transformation Business | 102.4 | 15.0 | 88.0 |
| Transportation & Construction Systems | 88.9 | (1.0) | 90.0 |
| Mineral Resources | 82.3 | 10.0 | 73.0 |
| Diverse Urban Development | 81.5 | (2.0) | 84.0 |
| Steel | 74.3 | 9.0 | 66.0 |
| Automotive | 63.2 | 25.0 | 38.0 |
| Digital AI | 35.3 | 2.0 | 33.0 |
| Chemical Solutions | 26.5 | (2.0) | 28.0 |
| Communication Services | 16.0 | 1.0 | 15.0 |
| Lifestyle Business | (3.6) | (14.0) | 10.0 |
| Corporate and Eliminations | 33.5 | 30.0 | 3.0 |
| Total | 600.3 | 72.0 | 528.0 |
The middle column is rounded, the outer two are not. Each segment’s one-off figure is given to the nearest ¥1bn, so the column sums to 73.0 against the 72.0 the company states. The reported and underlying columns both sum exactly. The difference between those two is 72.3, which is the figure to trust.
¥528 B underlying against ¥600.3 B reported. The two largest adjustments go in opposite directions: Automotive reported ¥63.2 B of which ¥25 B was one-off, so it earned ¥38 B; Lifestyle Business reported a loss of ¥3.6 B that contained ¥14 B of extraordinary losses, so it actually earned ¥10 B.
Then the forecast. The company expects ¥620 B underlying next year and ¥660 B reported — and then subtracts a ¥30 B loss buffer to prepare for uncertainties such as heightened uncertainty surrounding the situation in the Middle East, publishing ¥630 B as the headline. A company that deducts a provision for events it cannot yet name, from its own guidance, before showing it to anyone, is doing something the other four do not do at all.
Why it trades where it does
The puzzle this page opened with was that Sumitomo earns more on equity than Mitsubishi or Mitsui and trades at a discount to both. Four things close it, and three of them are specific to this company rather than to the sector.
One. The reported earnings are flattered
Management's own bridge puts underlying profit at 528 against 600.3 reported — 12.0% of the headline is items it labels one-off. Restate the multiples on that basis and the cheapness halves: the shares go from 11.5× earnings to 13.1×, and the return on equity from 12.9% to 11.4%. Still the cheapest of the five, and no longer by the margin the reported column suggests.
Two. The whole-capital return has not moved
This is the heart of it, and Sumitomo is the only one of the five that hands you the number. Return on invested capital was 8.0% under SHIFT 2023 and is 8.0% now, with 8.0% forecast for 2027 — while invested capital went from ¥7.6 tn to ¥9.4 tn, up 23.7%. A company that puts a quarter more capital to work and earns the same rate on it has grown without compounding, and a market that declines to pay a higher multiple for that is not being irrational.
Three. And the new capital went to the weaker lines
Of the ¥2.1 tn of invested capital added since SHIFT 2023, 46.6% — ¥1.0 tn — went into segments earning less than the company's own whole-capital return. That is the allocation record the 8.0% flat line is made of, and it is visible in the segment table above: the two largest absolute additions sit in lines returning single digits.
Four. The record earns a risk discount
Over the ten years Sumitomo averaged 9.9% on equity, the lowest of the five, with a -6.0% trough in 2021. It is also the only house in this section that pre-books a provision against trouble it has not had yet: the 2027 guidance carries a 30 billion yen buffer, in the company's own words, to prepare for uncertainties such as heightened uncertainty surrounding the situation in the Middle East.
What it is not
It is tempting to file the discount under governance, and the evidence points the other way. Sumitomo published a full response to the Tokyo Stock Exchange's demand that companies trading below book address it, committed in writing to “consistently achieve an ROE of 12% or higher”, and set out 5 measures to get there — including monitoring return on invested capital against the cost of capital for each business unit, and the 4-for-one share split that took effect on July 1, 2026. That is more disclosure than any of the other four offer.
Which produces the irony this page ends on. Sumitomo is cheap in part because it is the most transparent of the five. It publishes the segment return on invested capital that shows the problem, and the underlying-profit bridge that shows how much of the headline is non-recurring. The other four disclose neither. A reader comparing reported multiples across the section is comparing one company that has shown its working with four that have not — and the discount is, at least partly, the price of having shown it.
Conventions
- Fiscal years. Every column is labelled by the date it ends. The year ended 31 March 2026 is FY2026 to the data vendors and FY2025 to Sumitomo, as it is to Mitsubishi, Itochu and Marubeni.
- The share split. Sumitomo splits its shares 4 for one on July 1, 2026, after the year this page reports on. Every per-share figure here is on the post-split basis, which is why the latest dividend reads ¥37.5 where the company’s own announcement says ¥150.
- Return on equity. Net profit attributable to owners of the parent over average equity, the mean of the opening and closing balances.
- Return on assets. Net profit over average total assets, on the same basis, so that return on equity decomposes exactly into return on assets times leverage.
- Return on invested capital. Sumitomo’s own measure and its own figures, not a reconstruction. It is a whole-capital return and is not comparable with the return on assets in the same tables, which has a different numerator and a different denominator.
- Underlying profit. The company’s own measure: reported profit less asset replacement and extraordinary gains and losses, at its own rounding. This page classifies nothing as one-off that Sumitomo has not.
- The loss buffer. A deduction the company makes from its own forecast for uncertainties it cannot yet quantify. It is a forecasting convention, not an accounting one, and it does not appear in any reported figure.
Follow the research
New valuations and research notes, a few times a year. No promotional email, no sharing of your address, unsubscribe in one click.
Delivered by Buttondown. You can also subscribe by RSS.