
The best return of the five, and mostly not the earnings
Marubeni returned more than any of the other four houses over the five years to March 2026, and the usual way to read that is as an earnings story. It is mostly not. The earnings roughly tripled; the market capitalisation went up nearly eightfold. The difference is the multiple, and the company had said in writing that the multiple was the plan.
Equity not quite tripled. The market capitalisation went up almost eightfold. Marubeni wrote down that re-rating as an objective, in a published plan, and then hit a 2031 market-cap target in February 2026.
- 1 Equity grew 2.6× over the ten years. The market capitalisation grew 7.8×. Profit grew 3.5× and book value per share 2.7×. Price to book went from 0.7× to 2.1× — and from 1.1× to 2.1× in the final twelve months alone.
- 2 The re-rating was the stated plan, and the target was hit five years early. GC2027 set out to “elevate Market Cap beyond ¥10 tn” by March 2031. The company reports it reached that in February 2026. The year still closed at ¥9.2 tn, because it had come back below.
- 3 62.2% of the profit is earned by companies Marubeni does not consolidate — and it says which. ¥3.5 tn of the balance sheet, 33.3% of it, is carried as investments in associates and joint ventures. Marubeni splits both that capital and the profit it produces across every segment. No other house in this section does.
- 4 The largest profit line earned it once. Finance, Leasing & Real Estate reported ¥162.0 B — 29.4% of the segment total — on an operating loss of ¥5.2 B, with ¥90 B of items the company itself calls one-time. Its own forecast takes the segment to ¥76 B next year.
What the market paid, and what the company built
Over the five fiscal years to 31 March 2026, Marubeni returned more in yen than any of the other four houses. Read quickly, that is a story about a trading company earning its way out of a bad patch. The ten-year record says something more specific.
Equity went from ¥1.7 tn to ¥4.4 tn, a multiple of 2.6×. Book value per share, which is the measure that matters to an owner, went from ¥970 to ¥2,663 — 2.7×. Profit went from ¥155.4 B to ¥543.9 B, 3.5×. The market capitalisation went from ¥1.2 tn to ¥9.2 tn: 7.8×.
The two lines track each other for five years and then separate. Price to book tells the same thing in one number: 0.7× in 2017, below book value in each of the first five years, as low as 0.6× in 2020, and 2.1× now. 3.4× between the cheapest year and the dearest.
Most of that happened recently. In the twelve months to 31 March 2026 the market capitalisation went from ¥3.9 tn to ¥9.2 tn — 2.3× — while equity rose 20% and profit 8%. Price to book went from 1.1× to 2.1× in that one year.
None of this is a criticism. A company valued at 0.6× its book in 2020 and at 2.1× now has had something recognised about it. But an owner buying today is buying at the recognised price, and the part of the return that came from the multiple cannot happen twice in the same way.
The company said this was the plan
What makes the re-rating worth a chapter rather than a footnote is that Marubeni wrote it down as an objective. The GC2027 strategy says it will expand the market capitalisation by sustaining return on equity while “improving PER (by reducing CoE and elevating growth expectations)” — that is, by moving the price-to-earnings multiple, through a lower cost of equity and higher growth expectations. Of the plans this site has read across the five houses, it is the only one that names the multiple as something management intends to move.
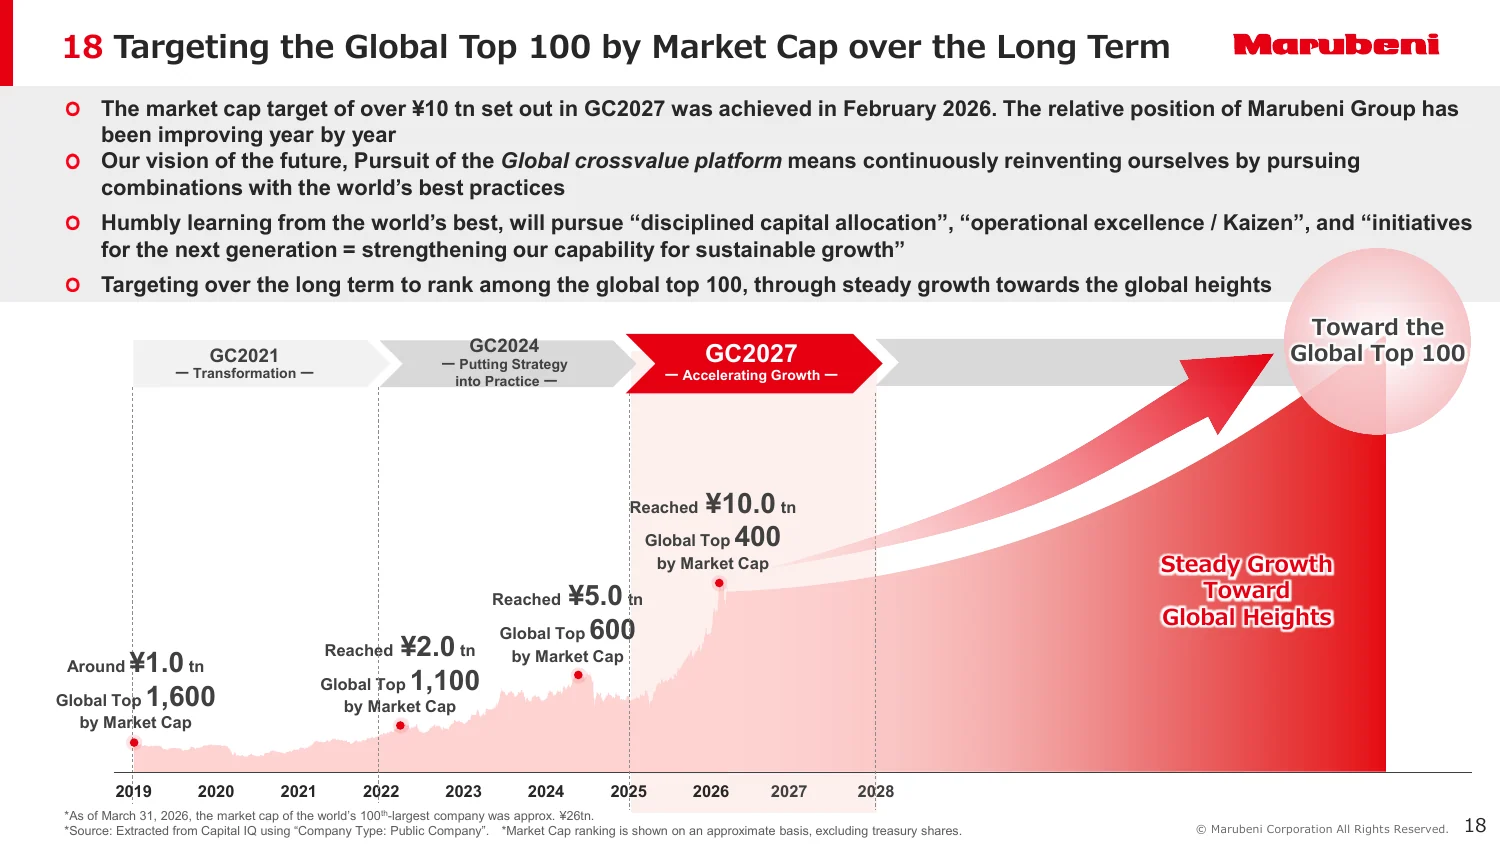
| Year | Market capitalisation | Global rank by market capitalisation |
|---|---|---|
| 2019 | around ¥1 tn | 1,600 |
| 2022 | ¥2 tn | 1,100 |
| 2024 | ¥5 tn | 600 |
| 2026 | ¥10 tn | 400 |
The target was ¥10 tn by March 2031. The company reports reaching it in February 2026 — five years early, and two years into a three-year plan. By the fiscal year end five weeks later the market capitalisation was ¥9.2 tn, back below the line. Both facts are true and the page states both, because a target touched in one month and not held in the next is not the same as a target met.
The slide’s own footnote is the most useful thing on it. As of 31 March 2026, it says, the market capitalisation of the world’s hundredth-largest company was about ¥26 tn. The stated long-term ambition is to join that hundred. From ¥9.2 tn that is another 2.8× — more than the whole journey from ¥5 tn to here. The company put the number on the page itself, which is the opposite of overselling.
Whose profit is it
62.2% of the latest year’s profit — ¥338.3 B of ¥543.9 B — is the group’s share of profit from associates and joint ventures: companies it influences but does not consolidate. That is the highest of the four houses this site holds a balance sheet for, against 58.5% at Mitsubishi, 53.7% at Mitsui and 35.9% at Itochu.
On the Mitsubishi page that figure is where the analysis has to stop: the equity-method book is disclosed in aggregate and 76.2% of it is not attributed to any named company. Marubeni publishes the same thing split across every segment — both the profit the affiliates earn and the capital invested in them. So the question can actually be answered here.
Power & Infrastructure is the extreme case and the one that needs explaining. Its consolidated businesses lost ¥25.1 B at the operating line; its affiliates earned ¥72.0 B; the segment reported ¥53.6 B. That is 134% of its profit from companies the group does not control — more than all of it. The same shape, less extreme, is at Finance, Leasing & Real Estate: an operating loss of ¥5.2 B and ¥90.4 B from affiliates. Metals & Mineral Resources is the largest in absolute terms, ¥128.7 B of its ¥134.3 B, or 96%.
| Segment | Operating profit | Share of affiliate profit | Net profit | From affiliates | Invested in affiliates | Segment assets | In affiliates |
|---|---|---|---|---|---|---|---|
| Power & Infrastructure Services | (25.1) | 72.0 | 53.6 | 134% | 807 | 1,776 | 45% |
| Metals & Mineral Resources | 26.5 | 128.7 | 134.3 | 96% | 1,160 | 1,648 | 70% |
| Finance, Leasing & Real Estate Business | (5.2) | 90.4 | 162.0 | 56% | 921 | 1,021 | 90% |
| Energy & Chemicals | 49.7 | 11.2 | 23.2 | 48% | 105 | 1,148 | 9% |
| Aerospace & Mobility | 49.4 | 14.5 | 47.8 | 30% | 219 | 839 | 26% |
| Next Generation Business Development | 12.8 | 5.8 | 19.6 | 30% | 69 | 298 | 23% |
| Food & Agri Business | 106.7 | 11.2 | 81.5 | 14% | 139 | 2,701 | 5% |
| Lifestyle | 38.3 | 2.9 | 25.9 | 11% | 67 | 668 | 10% |
| Next Generation Corporate Development | (1.4) | 1.7 | (1.7) | — | 31 | 132 | 24% |
| IT Solutions | 11.4 | (0.1) | 5.4 | -2% | 8 | 272 | 3% |
Read down the last column. ¥3.5 tn of Marubeni’s ¥10.5 tn balance sheet — 33.3% — is money in companies whose revenues, costs and borrowings never appear in these accounts. A third of the balance sheet is a single line. That is not a criticism of Marubeni, which is the only one of the four to show you the split; it is a statement about what the consolidated figures on this page can and cannot tell you.
It also sets the return figures in context. Return on segment assets at Metals & Mineral Resources is 8.2%, which looks respectable until you notice that 70% of those assets are an investment balance rather than operating assets, and that 96% of the return comes from them. The denominator and the numerator are describing the same thing.
What recurs
Every company has one-time items. Marubeni is the only one of the five that publishes them segment by segment and quarter by quarter, with the transactions named, alongside how much of next year’s forecast is made of the same thing.
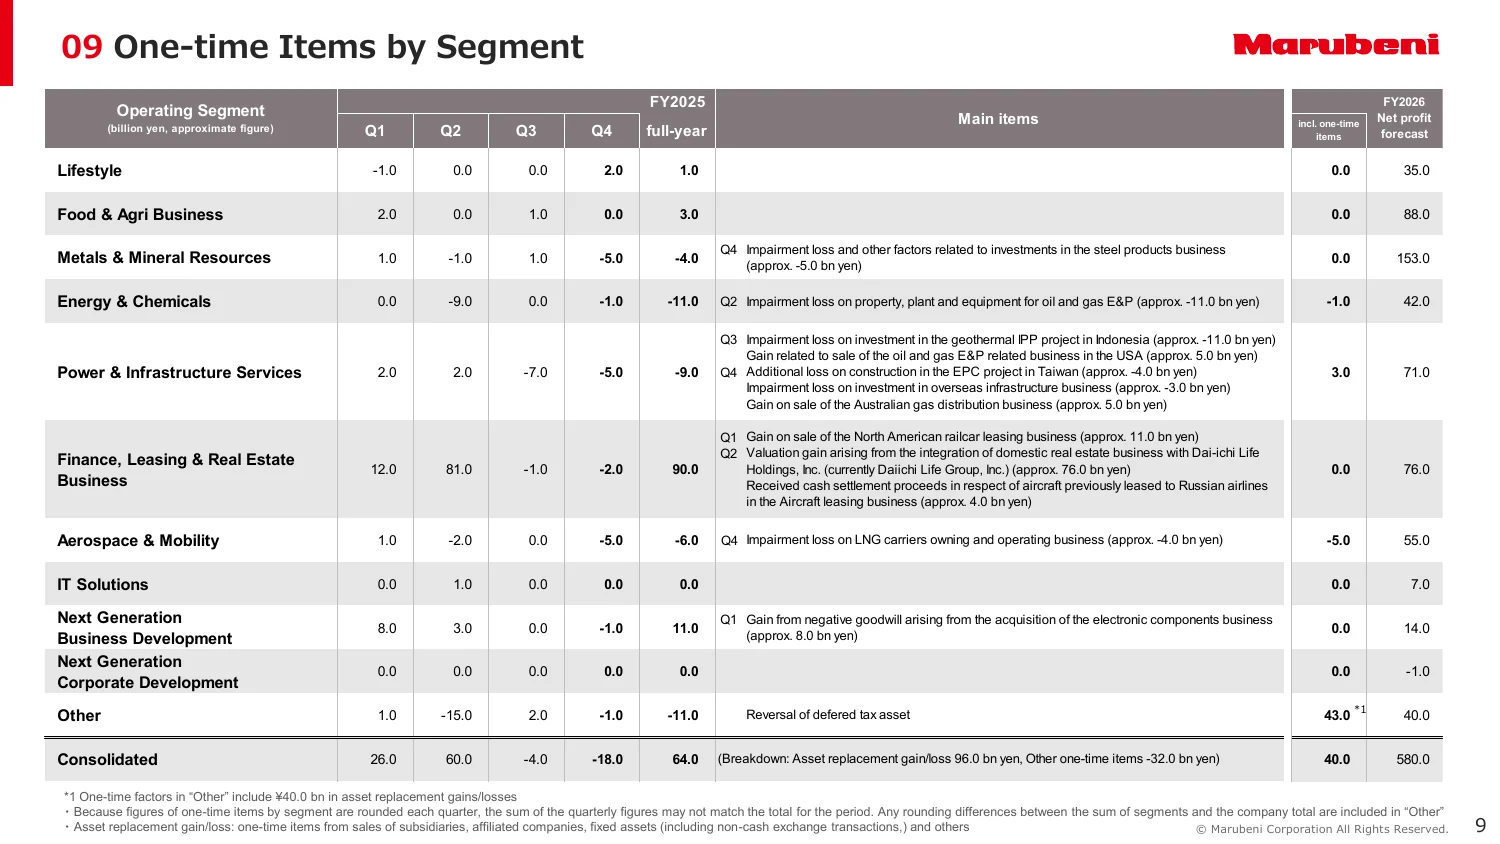
| Segment | Year ended 31 March 2026 | In the year to 31 March 2027 forecast |
|---|---|---|
| Finance, Leasing & Real Estate Business | 90.0 | 0.0 |
| Next Generation Business Development | 11.0 | 0.0 |
| Food & Agri Business | 3.0 | 0.0 |
| Lifestyle | 1.0 | 0.0 |
| IT Solutions | 0.0 | 0.0 |
| Next Generation Corporate Development | 0.0 | 0.0 |
| Metals & Mineral Resources | (4.0) | 0.0 |
| Aerospace & Mobility | (6.0) | (5.0) |
| Power & Infrastructure Services | (9.0) | 3.0 |
| Energy & Chemicals | (11.0) | (1.0) |
| Other | (11.0) | 43.0 |
| Consolidated | 64.0 | 40.0 |
Quarterly figures are rounded, so a segment’s quarters need not sum to its year, and rounding differences between the segments and the company total are carried in "Other".
¥64 B of one-time items against ¥543.9 B of profit. Strip them and the year earned ¥479.9 B — still a record, still ahead of the ¥503.0 B before it, but by -4.6% rather than 8.1%.
Almost all of it sits in one segment. Finance, Leasing & Real Estate carries ¥90 B of the ¥64 B, of which about ¥76bn is a valuation gain — not a cash sale — on folding the domestic real estate business into a venture with Dai-ichi Life Holdings. The remainder is a gain on selling the North American railcar leasing business and a settlement on aircraft previously leased to Russian airlines.
The company’s own forecast is the confirmation. It expects Finance, Leasing & Real Estate to earn ¥76 B in the year to March 2027, against ¥162.0 B this year: a fall of ¥86 B, almost exactly the one-time items in the segment. Marubeni is telling you in its own guidance that this year’s biggest profit line is not next year’s.
And the group total still rises, from ¥543.9 B to ¥580 B, because seven of the other ten lines are forecast up. That is the useful way to read the table: not that the year was flattered, but that the company has shown exactly where the flattering was and what it expects to replace it.
The segments, and how long they have existed
Marubeni reports ten operating segments and an “Other” row for head office costs, inter-segment elimination and unallocated financing cash. Unlike Mitsui’s pair of residual rows, Other here is small — ¥30 B of assets — so excluding it from the shares below barely moves a denominator.
The harder problem is time. Two years of this table exist, and that is all.
The segments have been reorganised twice in two years. Effective with the year ended 31 March 2026, Marubeni collapsed 16 operating segments into 10 and restated the prior year to match — which is why this table starts in 2025 rather than running the ten years the financial table below does. Then, effective with the year ending 31 March 2027, it moved part of Power & Infrastructure Services into Energy & Chemicals and part of Next Generation Business Development's neighbour into Lifestyle, and reclassified the year below again. The consolidated total is unchanged on every basis; four segment figures are not.
| Segment | As reported for the year ended 31 March 2026 | Reclassified in the following year’s forecast |
|---|---|---|
| Lifestyle | 25.9 | 25.2 |
| Energy & Chemicals | 23.2 | 22.2 |
| Power & Infrastructure Services | 53.6 | 54.6 |
| Next Generation Business Development | 19.6 | 20.3 |
Finance, Leasing & Real Estate earns 29.4% of the profit on 9.7% of the assets, a spread of 19.7 points — which the chapter above has already explained away: most of it is one-time, and most of the rest is affiliates. Food & Agri Business is the mirror, 14.8% of the profit on 25.7% of the balance sheet, and it is the one segment on this page that is unambiguously an operating business: ¥106.7 B of operating profit against ¥11.2 B from affiliates.
| Segment | 2025 profit | 2026 profit | Assets | Share of profit | Share of assets | Return on assets |
|---|---|---|---|---|---|---|
| Finance, Leasing & Real Estate Business | 59.1 | 162.0 | 1,021 | 29.4% | 9.7% | 15.9% |
| Metals & Mineral Resources | 123.5 | 134.3 | 1,648 | 24.3% | 15.7% | 8.2% |
| Next Generation Business Development | 4.7 | 19.6 | 298 | 3.6% | 2.8% | 6.6% |
| Aerospace & Mobility | 51.4 | 47.8 | 839 | 8.7% | 8.0% | 5.7% |
| Lifestyle | 29.5 | 25.9 | 668 | 4.7% | 6.4% | 3.9% |
| Power & Infrastructure Services | 61.1 | 53.6 | 1,776 | 9.7% | 16.9% | 3.0% |
| Food & Agri Business | 68.9 | 81.5 | 2,701 | 14.8% | 25.7% | 3.0% |
| Energy & Chemicals | 86.2 | 23.2 | 1,148 | 4.2% | 10.9% | 2.0% |
| IT Solutions | 3.5 | 5.4 | 272 | 1.0% | 2.6% | 2.0% |
| Next Generation Corporate Development | (2.2) | (1.7) | 132 | -0.3% | 1.3% | -1.3% |
| Other | 17.3 | (7.7) | 30 | — | — | — |
Ten years of assets, equity and earnings
Return on assets and leverage are both struck on average balances, so they multiply back to return on equity exactly. Both are blank in the first year, which has no opening balance sheet to average against. The affiliate share is blank in the loss year, where a share of a negative number means nothing.
| Year | Total assets | Equity | Net profit | Affiliate profit | From affiliates | Return on assets | Leverage | Return on equity | Book value per share | Price to book |
|---|---|---|---|---|---|---|---|---|---|---|
| 2017 | 6,897 | 1,684 | 155.4 | 114.7 | 74% | — | — | 10.4% | 970 | 0.7× |
| 2018 | 6,877 | 1,771 | 211.3 | 148.5 | 70% | 3.1% | 4.0× | 12.2% | 1,021 | 0.8× |
| 2019 | 6,809 | 1,978 | 230.9 | 85.3 | 37% | 3.4% | 3.7× | 12.3% | 1,140 | 0.7× |
| 2020 | 6,320 | 1,515 | (197.5) | (35.1) | — | -3.0% | 3.8× | -11.3% | 873 | 0.6× |
| 2021 | 6,936 | 1,815 | 223.3 | 120.5 | 54% | 3.4% | 4.0× | 13.4% | 1,045 | 0.9× |
| 2022 | 8,256 | 2,242 | 424.3 | 220.9 | 52% | 5.6% | 3.7× | 20.9% | 1,302 | 1.1× |
| 2023 | 7,954 | 2,878 | 543.0 | 243.4 | 45% | 6.7% | 3.2× | 21.2% | 1,697 | 1.1× |
| 2024 | 8,924 | 3,460 | 471.4 | 260.5 | 55% | 5.6% | 2.7× | 14.9% | 2,066 | 1.3× |
| 2025 | 9,202 | 3,629 | 503.0 | 292.9 | 58% | 5.5% | 2.6× | 14.2% | 2,188 | 1.1× |
| 2026 | 10,532 | 4,364 | 543.9 | 338.3 | 62% | 5.5% | 2.5× | 13.6% | 2,663 | 2.1× |
The record runs from -11.3% in 2020 — the one loss year, when a ¥168 B fall in equity accompanied a ¥197.5 B loss — to 21.2% in 2023. 2 of the ten years cleared the 15% the current plan asks for, both of them in the commodity run of 2022 and 2023. The latest year is 13.6%, which is 1.4 points short.
The share count has fallen from 1,735 million to 1,638 million, a reduction of 5.6%. That is much the smallest of the four — Mitsubishi has retired 23.0%, Mitsui 19.7% and Itochu 10.8%. Marubeni’s return to owners came from the multiple and the dividend, which has gone from ¥23 to ¥108 a share, not from the share count.
Ten years of segments
This page argues that the re-rating was the plan rather than the earnings. The segment record is where that gets tested, and it is also where Marubeni is least readable of the five: four reporting bases in ten years, two sources, and not one operating line that keeps its name throughout.
Marubeni has re-cut its reporting segments 3 times since 2017, at 2018, 2019 and 2025. Matching segment names across a break like that splices two definitions together and calls the result a trend, so the eras are kept apart here and each figure says which basis it is on.
| Years | Segments | The basis |
|---|---|---|
| 2017 | 6 | Six segments. The oldest basis, with chemicals and forestry in one line and energy and metals in another. |
| 2018 | 7 | Seven segments. Food and Consumer Products split in two; everything else carries over. |
| 2019–2024 | 19 | Fifteen to seventeen segments, itself unstable. Six years in which the basis never quite settled: Plant became Infrastructure Project in 2020, Food split into Food I and Food II in 2021, and a next-generation corporate line appeared in 2022. Segments absent from a year are null, not nought. |
| 2025–2026 | 11 | Eleven segments, and a different source. The current basis, with 2025 restated onto it by the company. These two years come from Marubeni's own full-year presentation rather than from the vendor, which carries no segment profit for either of them — so the join between 2024 and 2025 is a change of source as well as a change of basis, and nothing should be read across it. |
Two sources sit behind these ten years, and the join is a change of source as well as of basis: Capital IQ segment disclosure, as reported in each year, then Marubeni, Full-year IR Presentation FYE 3/2026.
2019 carries segment assets but no segment profit, because the vendor's segment profit does not sum to the group accounts for this year. The figure is withheld rather than published wrong or balanced to the total.
No operating segment keeps its name across the ten years. The only lines that run throughout are the residual ones — the corporate and elimination rows that exist to make the others add up. An outside reader cannot watch a single Marubeni business compound over the decade, because the company stopped reporting it as one business more than once.
What the balance sheet holds now
The current basis, ranked by the assets each line carries against what it earns on them. 6 of the 10 earn less on their own assets than the group earns on all of its.
| Segment | Assets | Share | Profit | Return on assets |
|---|---|---|---|---|
| Food & Agri Business | 2,701 | 25.7% | 81.5 | 3.0% |
| Power & Infrastructure Services | 1,776 | 16.9% | 53.6 | 3.0% |
| Metals & Mineral Resources | 1,648 | 15.7% | 134.3 | 8.2% |
| Energy & Chemicals | 1,148 | 10.9% | 23.2 | 2.0% |
| Finance, Leasing & Real Estate Business | 1,021 | 9.7% | 162.0 | 15.9% |
| Aerospace & Mobility | 839 | 8.0% | 47.8 | 5.7% |
| Lifestyle | 668 | 6.4% | 25.9 | 3.9% |
| Next Generation Business Development | 298 | 2.8% | 19.6 | 6.6% |
| IT Solutions | 272 | 2.6% | 5.4 | 2.0% |
| Next Generation Corporate Development | 132 | 1.3% | (1.7) | -1.3% |
Over the ten years total assets grew 52.7% and equity 159%, against profit 250%. Those three are continuous whatever the segments did, which is why the group figures carry the long view on this page and the segment tables carry the detail.
What management has committed to
Before the current plan, the one before it. Marubeni scores 6 financial targets from GC2024 and reports every one met or beaten.
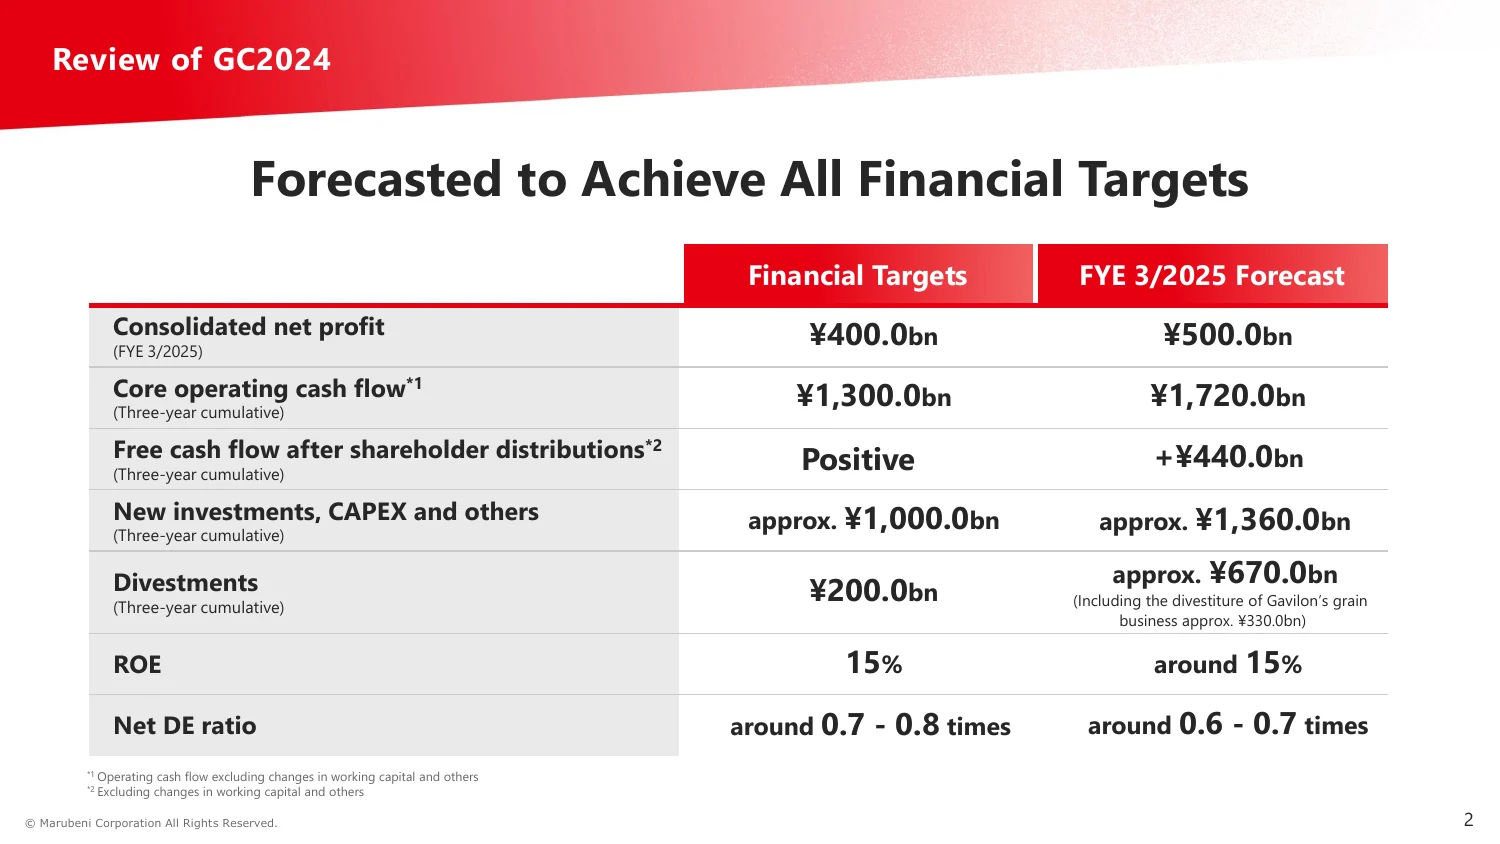
| Target | Set at | Came in at |
|---|---|---|
| Consolidated net profit, year to March 2025 | ¥400 B | ¥500 B |
| Core operating cash flow, three-year cumulative | ¥1,300 B | ¥1,720 B |
| Free cash flow after shareholder distributions, three years | Positive | ¥440 B |
| New investments, capital expenditure and others, three years | ¥1,000 B | ¥1,360 B |
| Divestments, three years | ¥200 B | ¥670 B |
| Return on equity | 15% | around 15% |
Two of those rows are worth separating from the rest. Divestments were set at ¥200 B and came in at ¥670 B, more than three times the target — but about half of that was one transaction, the sale of the Gavilon grain business. And the return-on-equity row reads “15%” against “around 15%”, which is a target scored as met by a company grading its own approximation. Neither is dishonest. Both are reasons to prefer the segment tables above to the scorecard.
GC2027
The current plan runs to 31 March 2028 and asks for profit of over ¥620 B — a compound rate of about 10% a year, struck not from the reported profit but from an adjusted figure of ¥460 B, which is profit excluding one-time items. Given the chapter above, that is the right base to use, and it is worth noticing that the company chose it.
| Target | Set at | Latest |
|---|---|---|
| Consolidated net profit, year to March 2028 | over ¥620 B | ¥543.9 B |
| Return on equity | 15% | 13.6% |
| Core operating cash flow, three-year cumulative | ¥2.0 tn | — |
| Total payout ratio | around 40% | — |
| Annual dividend per share, floor | ¥100 | ¥108 |
| Market capitalisation, by March 2031 | over ¥10 tn | ¥9.2 tn |
Three of the six are already at or near the line with two years of the plan left: the dividend is above its floor, the market capitalisation touched its 2031 target in 2026, and profit at ¥543.9 B needs 14.0% more over two years to clear ¥620 B. The one that is not close is the return on equity, and it is the one the market-capitalisation target was supposed to rest on.
The same business as Itochu, twice
Two of the five houses on this site have the same founder. Chubei Itoh started a linen trade in 1858; the sales divisions were split in 1918; and the half that became Marubeni re-formed in 1921 and took its present corporate form in 1949. Itochu dates itself from the same 1858.
| Year | What happened |
|---|---|
| 1858 | Chubei Itoh leaves the family business and starts a linen trade with his uncle. Itochu and Marubeni both descend from it. |
| 1918 | The sales divisions are split into C. Itoh & Co., Ltd. and Itochu Shoten, Ltd. — the fork that makes the two houses separate. |
| 1921 | Marubeni Shoten, Ltd. is formed from the merger of Itochu Shoten and Itoh Chobei Shoten. |
| 1949 | Marubeni Co., Ltd. is established. It takes the name Marubeni Corporation in 1972. |
168 years after that linen trade, and 108 years after the split, the two halves earn 14.6% and 13.6% on equity, and the market pays 2.1× and 2.1× for their books. For two companies that have been separate for more than a century, that is a remarkably small gap — and it arrives by opposite routes. Itochu earns its return from businesses it consolidates; 62.2% of Marubeni’s comes from companies it does not.
Conventions
- Fiscal years. Every column is labelled by the date it ends. The year ended 31 March 2026 is FY2026 to the data vendors and FY2025 to Marubeni, as it is to Mitsubishi and Itochu; Mitsui labels the same year FY2026. The plan years are labelled by their own end dates throughout.
- Net profit. Profit for the year attributable to owners of the parent, which is what Marubeni’s segment note reports and what the group line sums to.
- Return on equity. Net profit over average equity, the mean of the opening and closing balances.
- Return on assets. Net profit over average total assets, on the same basis, so that return on equity decomposes exactly into return on assets times leverage.
- Operating profit. Marubeni’s own measure, which it states is presented in accordance with Japanese accounting practice and is not required by IFRS. It is gross trading profit less selling, general and administrative expenses and allowances for doubtful accounts. It is used here only to show what a segment earns before affiliate profit, which is the one job it does well.
- Affiliate profit and affiliate capital. “Share of profit of associates and joint ventures” and “Investments in associates and joint ventures”, both as the segment note reports them. A share above 100% means the segment’s consolidated businesses lost money.
- One-time items. The company’s own figures and its own definition, rounded by it to the nearest ¥1bn. This page does not classify anything as one-time that Marubeni has not.
- Market capitalisation. At each fiscal year end, from Capital IQ. The February 2026 figure is the company’s own statement and is not a year-end measurement.
Follow the research
New valuations and research notes, a few times a year. No promotional email, no sharing of your address, unsubscribe in one click.
Delivered by Buttondown. You can also subscribe by RSS.