
More than half its profit comes from companies it does not consolidate
Mitsubishi is the largest of the five houses and the hardest to read. Its earnings have fallen three years running, it earns the lowest return on equity of the five, and its shares have multiplied several times over regardless. The gap between those facts is the whole page.
Return on equity of 8.5% against a 12% target is not one problem but a choice between two: earn ¥1.1 trillion on today's balance sheet, which the company has done once, or carry today's earnings on ¥2.7 trillion less equity.
- 1 58.5% of the latest year’s profit came from companies Mitsubishi does not consolidate. ¥468 B of equity-method income against ¥800 B of net income — the highest share in the ten-year record, which has run from 23.2% to 58.5%. An earnings multiple on this company is measuring something other than the earnings it controls.
- 2 Where the profit comes from is not where the capital sits. Environmental Energy earns 20.0% of the profit on 12.6% of the balance sheet. Others does the reverse: 6.4% of the profit on 12.2% of the assets.
- 3 Return on equity is 8.5% against a 12% target, and it decomposes exactly: 3.5% on assets times 2.4× leverage. Closing the gap means earning ¥1,129 B on today’s equity —just inside the ¥1,181 B peak of 2023 — or carrying today’s earnings on ¥2.7 tn less of it.
- 4 The house dates from 1870; the company dates from 1954. The zaibatsu was dissolved in 1947 and what listed in 1954 was a re-merger. Mitsubishi’s own corporate history begins there, the data vendors record 1950, and all three answers are defensible.
The house, and the company
Ask how old Mitsubishi Corporation is and there are three answers. The group dates its origin to 1870, when Yataro Iwasaki started a shipping firm with three aging steamships. The data vendors record the company as founded in 1950. And Mitsubishi’s own corporate history page does not begin until 1954, filing everything before it under a separate section titled “Our Roots”.
All three are right, and the distinction is worth holding onto, because it is the first thing that makes this company hard to read. Four Iwasakis ran the house for seventy-six years and built it from shipping into mining, banking, shipbuilding and trade. Then the zaibatsu was dissolved after the war and broken into what the group’s own site calls “the independent companies they are today”. What listed on the Tokyo and Osaka exchanges in 1954 was not a continuation of that house. It was a re-merger of its scattered trading pieces, and it is the entity you can buy.
| Year | What happened | Source |
|---|---|---|
| 1870 | Yataro Iwasaki starts a shipping firm with three aging steamships. | Mitsubishi group, "Origin" |
| 1946 | The fourth and last Iwasaki president, Koyata, leaves office. Four Iwasakis had run the house for seventy-six years. | Mitsubishi group, "Origin" |
| 1947 | The zaibatsu is dissolved. The organisation is broken up into what the group’s own site calls “the independent companies they are today”. | Mitsubishi group, "Origin" |
| 1954 | The Great Merger. New Mitsubishi Shoji is founded and listed on both the Tokyo and Osaka stock exchanges, under President Katsujiro Takagaki. | Mitsubishi Corporation, corporate history |
| 1967 | First management plan. | Mitsubishi Corporation, corporate history |
| 1971 | “Mitsubishi Corporation” adopted as the official English name. | Mitsubishi Corporation, corporate history |
| 1992 | A policy to become a “Sound, Global Enterprise” shifts the focus from transaction volume to consolidated profit and asset value. | Mitsubishi Corporation, corporate history |
| 1998 | MC2000 introduces a “Select & Focus” approach to the portfolio. | Mitsubishi Corporation, corporate history |
| 2022 | Midterm Corporate Strategy 2024 — “Creating MC Shared Value”. | Mitsubishi Corporation, corporate history |
| 2025 | Corporate Strategy 2027, announced 3 April 2025. | Corporate Strategy 2027 presentation |
The continuity that did survive the break is a statement of purpose. The Three Corporate Principles were formulated in the zaibatsu era and are still printed at the front of the strategy deck: Shoki Hoko, corporate responsibility to society; Shoji Komei, integrity and fairness; and Ritsugyo Boeki, global understanding through business. The third is not a platitude. “Global understanding through business” is a mandate for the trading model itself — a company whose edge is supposed to be knowing more about more markets than anyone it deals with. Whether that edge is still worth what it costs is, in effect, the question the rest of this page is about.
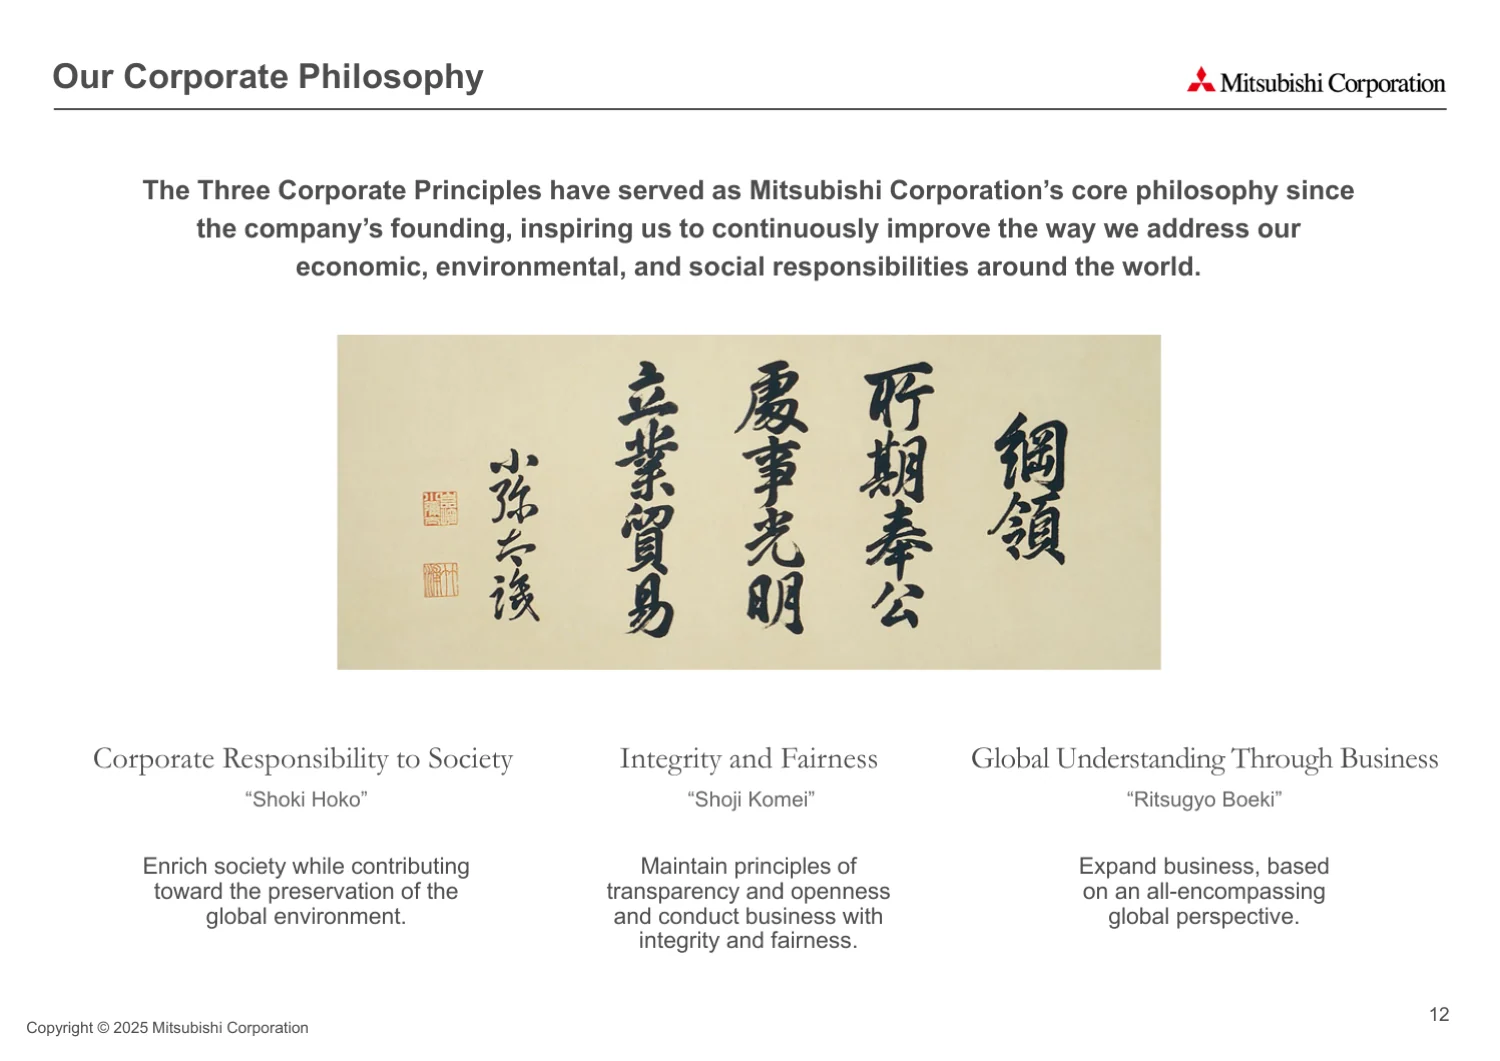
The scroll is worth looking at for one reason. The company that commissioned it was broken up in 1947 and the entity trading today is a re-merger of its pieces; the principles are the thing that crossed the gap intact, and they are still at the front of the strategy deck ninety years later. Whatever continuity Mitsubishi has between 1870 and 1954, this is the document form of it.
Mitsubishi runs on a 31 March fiscal year and calls the year ended 31 March 2026 “FY2025”. The data vendors call the same year “FY2026”. Every column on this page is therefore labelled by the date the period ended, and no fiscal-year name appears anywhere on it.
What it owns, and how it earns
The nine operating segments are a reasonable map of the business, and they are worth reading as what they are: nine portfolios of operating stakes, each with a trading desk attached. Mineral Resources holds steelmaking coal, copper, iron ore and lithium interests, mostly through joint ventures with the major miners. Environmental Energy runs the LNG business — Brunei, Malaysia, Australia, Oman, and the North American projects. Smart-Life Creation is the consumer end: retail, apparel, healthcare, food distribution and payments. Power Solution owns Eneco in the Netherlands and Diamond Generating in the Americas. Mobility is the Isuzu and Mitsubishi Motors value chain, concentrated in ASEAN. Food Industry runs from salmon farming and grain terminals to canned tuna.
Read that list again and notice what it is not. There is no segment whose earnings come from trading margin. The trading is how the company got the positions and how it still moves the volume, but the money is in owning the assets at either end of the trade. Which is why the next number is the most important one on this page.
More than half the profit arrives from outside the consolidation
¥468 B of the ¥800 B Mitsubishi earned in the year to March 31, 2026 was its share of the profit of affiliates it does not control — 58.5%, arriving as a single line in the income statement. The remaining ¥333 B is what the businesses it consolidates earned.
Three consequences follow, and they shape everything below. An earnings multiple on this company is measuring something other than the earnings it controls, because more than half of them arrive from businesses whose dividend policy and capital allocation Mitsubishi influences but does not set. Consolidated revenue is close to meaningless, because whether a trade is presented gross or net changes the top line by multiples without changing a yen of profit — Materials Solution books ¥3.6 tn of revenue to produce ¥26 B of profit, and nothing follows from that ratio. And a segment’s gross profit can fall by half while its net income barely moves, because the profit never passed through the gross line. Mineral Resources did exactly that: gross profit fell from ¥398 B to ¥175 B over three years while net income went from ¥296 B to ¥205 B.
Which companies, and what they are carried at
If more than half the profit arrives from companies Mitsubishi does not consolidate, the obvious question is which ones. The answer is in the Annual Financial Report, and it comes with a caveat that turns out to be the most interesting part of it: Mitsubishi names nine equity-method holdings and publishes a carrying amount for three of them.
That English report exists because Mitsubishi’s securities trade on the London Stock Exchange, which obliges it. The primary document is the Japanese annual securities report, which is not published in English — one reason these companies stay unread outside Japan.
The two halves of the balance sheet
The equity-method book sits inside total assets, so the balance sheet divides cleanly in two: the stakes in companies Mitsubishi does not control, and everything it does.
A fifth of the assets produces nearly three fifths of the profit. Put the other way round: the ¥18.9 tn Mitsubishi consolidates — the subsidiaries, the inventory, the plant, the ships, the mines it operates — earned 1.8% last year.
This is a comparison, not a ratio either half would report, and it is not like-for-like. Equity-method income arrives already net of the affiliate’s own tax and financing, while the consolidated remainder carries the whole group’s overheads, interest and tax and is struck after non-controlling interests. The gap is far too wide to be explained by that — but it is not 9.0% against 1.8% on identical terms.
What the book is made of
The equity-method book stood at ¥5.2 tn at March 31, 2026, against ¥5.1 tn a year earlier. Of that, the holdings carrying a published book value come to ¥1.2 tn — 23.8%. The remaining ¥4.0 tn, which is 76.2% of the book, is not attributed to any named company anywhere in the filing.
| Holding | Stake | Basis | Segment | Carrying value | Listed |
|---|---|---|---|---|---|
| Quellaveco | 40.0% | Associate | Mineral Resources | ¥523.5 B * | Peru |
| Lawson | 50.0% | Joint venture | Smart-Life Creation | ¥502.6 B | Japan |
| Anglo American Sur | 20.4% | Associate | Mineral Resources | ¥216.5 B | Chile |
| Mitsubishi HC Capital TSE:8593 | 18.4% | Associate | Others | not disclosed | Japan · yes |
| Mitsubishi Motors TSE:7211 | 22.3% | Associate | Mobility | not disclosed | Japan · yes |
| Olam Group SGX:VC2 | 14.7% | Associate | Food Industry | not disclosed | Singapore · yes |
| MI Berau | 56.0% | Joint venture | Environmental Energy | not disclosed | Indonesia |
| Sulawesi LNG | 75.0% | Joint venture | Environmental Energy | not disclosed | Indonesia |
| DRI-GP2 | 51.0% | Joint venture | Urban Development & Infrastructure | not disclosed | Vietnam |
| Named, total | — | — | — | ¥1,242.6 B | 23.8% of the book |
| Not attributed to any named company | — | — | — | ¥3,970.4 B | 76.2% of the book |
* Quellaveco’s figure is the investment book value and the loan to it, which Mitsubishi reports as one number and does not split. It is therefore not a pure carrying amount, and the named total above inherits that.
Two of the three with a published figure are copper mines and the third is a convenience-store chain. None of them is listed. Lawson was, until KDDI took it private alongside Mitsubishi in 2024, and it is now carried at ¥502.6 B — the single largest named holding after Quellaveco.
The listed ones, and the thing everybody assumes
The reason to care about which equity-method holdings are listed is a sum-of-the-parts argument: equity-method stakes are carried at cost plus the share of retained earnings less impairment, never marked to market, so a listed stake that has run up should be worth more than the balance sheet says. That is the argument this site makes about Berkshire’s own equity portfolio. Here it does not survive contact with the filing.
| Associate | Stake | Market capitalisation | Mitsubishi’s share, at market | Carried at |
|---|---|---|---|---|
| Mitsubishi HC Capital TSE:8593 | 18.4% | ¥2,012 B | ¥370.1 B | not disclosed |
| Mitsubishi Motors TSE:7211 | 22.3% | ¥411 B | ¥91.6 B | not disclosed |
| Olam Group SGX:VC2 | 14.7% | S$3.3 bn | ¥59.8 B † | not disclosed |
| All three, at market | — | — | ¥521.5 B | 10.0% of the book |
† Olam trades in Singapore dollars. Translated at 124.0 SGD/JPY on March 31, 2026, which is an approximate rate and the only place on this page a second currency is converted.
Three things follow. The listed associates are 10.0% of the equity-method book at market, so even a large mispricing in them would barely move the group. Mitsubishi does not publish what any of them is carried at, so the gap cannot be computed from the outside. And in the one year the question was forced into the open, the gap ran the wrong way.
In the year to March 31, 2026 Mitsubishi impaired Mitsubishi Motors by ¥35.7 B, and gave this reason. The carrying amount had "continuously exceeded its market value based on quoted share prices". Mitsubishi treated the holding as a single cash-generating unit and measured the recoverable amount on value in use — a discounted cash flow — rather than on the quoted price.
Read that twice, because it is the opposite of what a sum-of-the-parts reader expects. The listed stake was carried above what the market would pay for it, not below. And the impairment did not mark it to the quoted price: the recoverable amount was a discounted cash flow, which is management’s view of the business rather than the market’s. At 22.3% of a company worth ¥411 B, Mitsubishi’s stake is ¥91.6 B at market — and the balance sheet still does not say whether it carries it for more.
Where the writedowns have actually been
The equity-method line is where this company’s capital-allocation record is written, because an investment that disappoints shows up there rather than in the operating result. The clearest case is Anglo American Sur.
Mitsubishi bought 20.4% of the Chilean copper assets for $4.51 billion. At March 31, 2026 it carries them at ¥216.5 B — which the filing itself translates as $1.353 billion, or 30% of what was paid. And that is after writing ¥53.2 B back up last year on higher copper price forecasts.
Cost and carrying value are compared in dollars on purpose. The purchase was made when the yen was near 80 to the dollar and the carrying amount is a 2026 yen figure; converting the cost at today’s 158.7 would charge the investment with fifteen years of currency it never experienced and make the writedown look half again worse than it was.
Against that, the two largest assets in the whole group are not in this book at all. BMA steelmaking coal is a 50% joint operation with BHP, which means Mitsubishi books its share of the assets and liabilities line by line rather than as one investment. It is held through a wholly owned subsidiary, Mitsubishi Development Pty Ltd, which carries ¥1.2 tn of property, plant and equipment, acquired in 2001 for about ¥100 B. The Montney shale gas business moved the same way on October 1, 2025, when a revised agreement with Ovintiv ended the equity method and turned it into a joint operation — a reminder that the boundary between these categories moves, and that a change in it is not a change in the business.
Joint ventures against associates
The one structural cut Mitsubishi does publish is between joint ventures, where control is shared, and associates, where it has influence but not control. Associates are the larger half and the more stable one: ¥328 B against ¥140 B in the latest year, 70.2% of the total.
| Year ended | Joint ventures | Associates | Total | Associates’ share |
|---|---|---|---|---|
| 31 Mar 2024 | 134.2 | 310.2 | 444.4 | 69.8% |
| 31 Mar 2025 | 75.5 | 262.0 | 337.5 | 77.6% |
| 31 Mar 2026 | 139.7 | 328.3 | 467.9 | 70.2% |
The joint-venture half is where the volatility lives, and the filing says why: an ¥8.1 billion impairment on a Japanese power-plant joint venture in the year to March 2024, then ¥51.3 billion written off the Japanese offshore wind joint ventures in the year to March 2025 on inflation, a weaker yen, supply chains and rates. Both landed in Power Solution, which is the segment that swung from a ¥15.6 B loss to a ¥43.4 B profit in the table further down this page. The segment result and the equity-method line are the same story told twice.
Where the profit comes from, and where the capital sits
These are not the same place, and the distance between them is the most useful single view of the company. The chart below puts each segment’s share of the group’s profit next to its share of the group’s balance sheet. A line sloping down is a segment earning more than its size; a line sloping up is a segment being carried.
Environmental Energy is the standout on the right side of that ledger: 20.0% of the profit on 12.6% of the assets, a spread of 7.4 percentage points. At the other end, Others holds ¥3.2 tn — 12.2% of everything Mitsubishi owns — and returns 1.6% on it.
| Segment | Net income | Share of profit | Total assets | Share of assets | Return on segment assets | Spread, pp |
|---|---|---|---|---|---|---|
| Environmental Energy | ¥160.9 B | 20.0% | ¥3.3 tn | 12.6% | 4.8% | 7.4 |
| Urban Development & Infrastructure | ¥85.1 B | 10.6% | ¥2.2 tn | 8.2% | 3.9% | 2.4 |
| Food Industry | ¥83.3 B | 10.4% | ¥2.3 tn | 8.8% | 3.6% | 1.5 |
| Mineral Resources | ¥204.5 B | 25.4% | ¥6.0 tn | 22.6% | 3.4% | 2.8 |
| Smart-Life Creation | ¥91.0 B | 11.3% | ¥2.7 tn | 10.4% | 3.3% | 1.0 |
| Mobility | ¥57.6 B | 7.2% | ¥1.9 tn | 7.3% | 3.0% | (0.2) |
| Others | ¥51.8 B | 6.4% | ¥3.2 tn | 12.2% | 1.6% | (5.8) |
| Power Solution | ¥43.4 B | 5.4% | ¥2.7 tn | 10.3% | 1.6% | (4.9) |
| Materials Solution | ¥26.3 B | 3.3% | ¥2.0 tn | 7.4% | 1.3% | (4.2) |
| Adjustments and Eliminations | (¥3.5 B) | — | ¥-2.3 tn | — | — | — |
| Group | ¥800.5 B | 100.0% | ¥24.2 tn | 100.0% | 3.3% | — |
This is the asset-efficiency problem Corporate Strategy 2027 is written about, in the company’s own numbers. It is also why the return-on-equity discussion that follows is better read as a question about mix than as a question about effort: there is no plausible path from 8.5% to 12% that leaves ¥7.9 tn of capital earning under two per cent.
The group it does not control
This is the most common error in English-language coverage of the house, and it is worth settling before going any further. Mitsubishi Corporation does not own or control Mitsubishi UFJ, and it does not own or control Mitsubishi Heavy Industries. The three are peers. They are the gosanke — the three great houses — and the Mitsubishi group that contains them has no controlling parent at all. The group’s own site is explicit that the post-war entities are “the independent companies they are today”.
What holds them together is a name, a set of cross-shareholdings that are substantial without being controlling, and a lunch. Around thirty of the group companies send their most senior executives to the Friday Conference, the Kinyokai, which has been formally a social function since 1993. The three core houses meet separately beforehand. None of this is a control relationship and none of it consolidates: when you buy 8058 you are buying one trading company, not a share of the Mitsubishi group.
The role the company plays in Japan is better described through the balance sheet than through the group. A country with almost no domestic energy or mineral resources needs someone to own the upstream, carry the inventory, finance the importers and guarantee that the coking coal arrives. Mitsubishi has done that for seventy years, and the fact that it is the largest of five companies doing it is a reasonable measure of how much of Japan’s industrial supply chain sits on these five balance sheets rather than on the manufacturers’.
Ten years of assets, equity and earnings
Net income peaked at ¥1,181 B in the year to March 2023 and has fallen in each of the three years since, to ¥800 B. Shareholders’ equity went the other way, from ¥8,066 B to ¥9,441 B. Falling earnings on a rising equity base is an arithmetic guarantee of a falling return on equity, and that is what happened: 15.8% to 8.5%.
| Year ended | Total assets | Equity | Net income | Equity-method share | Book value per share | Shares, m | Return on equity | Price to book |
|---|---|---|---|---|---|---|---|---|
| 31 Mar 2017 | ¥15.8 tn | ¥4,917 B | ¥440 B | 26.7% | ¥1,034 | 4,756 | 9.3% | 0.8× |
| 31 Mar 2018 | ¥16.0 tn | ¥5,332 B | ¥560 B | 37.7% | ¥1,121 | 4,758 | 10.9% | 0.9× |
| 31 Mar 2019 | ¥16.5 tn | ¥5,696 B | ¥591 B | 23.2% | ¥1,196 | 4,761 | 10.7% | 0.9× |
| 31 Mar 2020 | ¥18.0 tn | ¥5,227 B | ¥535 B | 33.5% | ¥1,174 | 4,453 | 9.8% | 0.7× |
| 31 Mar 2021 | ¥18.6 tn | ¥5,614 B | ¥173 B | 56.3% | ¥1,268 | 4,428 | 3.2% | 0.8× |
| 31 Mar 2022 | ¥21.9 tn | ¥6,880 B | ¥938 B | 42.0% | ¥1,553 | 4,430 | 15.0% | 1.0× |
| 31 Mar 2023 | ¥22.1 tn | ¥8,066 B | ¥1,181 B | 42.4% | ¥1,882 | 4,286 | 15.8% | 0.8× |
| 31 Mar 2024 | ¥23.5 tn | ¥9,044 B | ¥964 B | 46.1% | ¥2,207 | 4,098 | 11.3% | 1.6× |
| 31 Mar 2025 | ¥21.5 tn | ¥9,369 B | ¥951 B | 35.5% | ¥2,355 | 3,978 | 10.3% | 1.1× |
| 31 Mar 2026 | ¥24.2 tn | ¥9,441 B | ¥800 B | 58.5% | ¥2,578 | 3,661 | 8.5% | 2.1× |
None of which is what the shares did. Over the window the hub’s return decomposition runs over — 31 March 2021 to 31 March 2026 — the price went from ¥1,043 to ¥5,315, a 5.1× multiple, for a yen total return of 447% with dividends. Earnings fell and the shares multiplied, and the reconciliation is the multiple: 0.8× book then against 2.1× now. That is the thing to hold in mind reading the rest of this page — the re-rating did more work than the business did.
Book value per share is the figure that behaves best in that table, and the reason is the share count. Equity compounded at 7.5% a year over the decade, but book value per share compounded at 10.7%, because the count fell 23.0% — from 4,756 million shares to 3,661 million. Mitsubishi has spent ¥2.1 tn on repurchases in the last five years, more than any of the other four houses, and it retired 17.3% of its shares doing it.
The target, decomposed
A return on equity is a return on assets multiplied by how many times the equity has been levered into those assets, and for the year to March 31, 2026 the identity closes exactly:
Written that way there are only two levers, and both can be priced.
Earn more on the same balance sheet. At today’s leverage, 12% on equity needs 4.9% on assets rather than 3.5% — which is ¥1,129 B of net income on today’s equity base. Mitsubishi has earned that much once in the decade, ¥1,181 B in the year to March 2023, at the top of the resource cycle. It is not an impossible number. It is a cyclical peak being asked to become a run rate.
Or carry today’s earnings on less equity. At today’s return on assets, 12% needs leverage of 3.4× rather than 2.4× — average equity of ¥6.7 tn instead of ¥9.4 tn, a reduction of ¥2.7 tn. Corporate Strategy 2027 commits ¥1.0 tn or more to buybacks over three years, which covers about 37% of that, and the plan’s own net debt-to-equity ceiling of about 0.6× limits how much further the second lever can be pushed.
So the honest reading of the 12% target is that it needs both levers, and most of the work has to come from the earnings side — which takes you straight back to the ¥7.9 tn of capital in the three worst segments. Buying back stock raises return on equity arithmetically. It does not make an asset earn more.
Ten years of segments
The chapter above reads the segments over the three years they are directly comparable. This one goes back ten, which means crossing two re-cuts — and what the crossing shows is that the largest of the five is also one of the hardest to follow through time.
Mitsubishi has re-cut its reporting segments twice since 2017, at 2019 and 2023. Matching segment names across a break like that splices two definitions together and calls the result a trend, so the eras are kept apart here and each figure says which basis it is on.
| Years | Segments | The basis |
|---|---|---|
| 2017–2018 | 9 | Nine segments, on the old product lines. The basis before the 2019 reorganisation, with Metals, Machinery and Living Essentials as the big three. None of those three names exists today. |
| 2019–2022 | 12 | Twelve segments. The reorganisation that replaced Metals with Mineral Resources, split energy into Environmental Energy and Petroleum & Chemicals Solution, and broke Living Essentials into Food Industry and Smart-Life Creation. |
| 2023–2026 | 10 | Ten segments, the current basis. Twelve became ten: Automotive & Mobility and Industrial Infrastructure merged into Mobility, Petroleum & Chemicals folded into Materials Solution, and Urban Development took Infrastructure with it. |
No operating segment keeps its name across the ten years. The only lines that run throughout are the residual ones — the corporate and elimination rows that exist to make the others add up. An outside reader cannot watch a single Mitsubishi business compound over the decade, because the company stopped reporting it as one business more than once.
What the balance sheet holds now
The current basis, ranked by the assets each line carries against what it earns on them. 3 of the 8 earn less on their own assets than the group earns on all of its.
| Segment | Assets | Share | Profit | Return on assets |
|---|---|---|---|---|
| Mineral Resources | 5,995 | 25.8% | 204.5 | 3.4% |
| Environmental Energy | 3,339 | 14.4% | 160.9 | 4.8% |
| Smart-Life Creation | 2,745 | 11.8% | 91.0 | 3.3% |
| Power Solution | 2,740 | 11.8% | 43.4 | 1.6% |
| Food Industry | 2,334 | 10.0% | 83.3 | 3.6% |
| Urban Dev. & Infrastructure | 2,174 | 9.4% | 85.1 | 3.9% |
| Materials Solution | 1,971 | 8.5% | 26.3 | 1.3% |
| Mobility | 1,943 | 8.4% | 57.6 | 3.0% |
Over the ten years total assets grew 53.3% and equity 92.0%, against profit 81.8%. Those three are continuous whatever the segments did, which is why the group figures carry the long view on this page and the segment tables carry the detail.
The segments, over the three years they are comparable
Three years and not ten, and that is a real limit rather than an omission: Midterm Corporate Strategy 2024 redrew the reporting segments, so the earlier years are reported on a map that does not splice onto this one. Nobody publishes a ten-year segment panel for this company on a single basis, and a page that showed one would be joining two different sets of definitions.
| Segment | 2024 | 2025 | 2026 | Change |
|---|---|---|---|---|
| Mineral Resources | 295.5 | 227.8 | 204.5 | (91.0) |
| Environmental Energy | 238.8 | 198.6 | 160.9 | (77.9) |
| Smart-Life Creation | 102.7 | 185.0 | 91.0 | (11.7) |
| Urban Development & Infrastructure | 50.9 | 39.8 | 85.1 | 34.2 |
| Food Industry | (25.3) | 92.4 | 83.3 | 108.6 |
| Mobility | 141.4 | 112.4 | 57.6 | (83.8) |
| Power Solution | 97.9 | (15.6) | 43.4 | (54.5) |
| Materials Solution | 73.9 | 68.3 | 26.3 | (47.5) |
| Others | (2.2) | 51.2 | 51.8 | 54.0 |
| Adjustments and Eliminations | (9.6) | (9.2) | (3.5) | 6.1 |
| Group | 964.0 | 950.7 | 800.5 | (163.6) |
Two segments change sign inside those three years. Food Industry lost ¥25.3 B in the year to March 2024 and earned ¥83.3 B two years later. Power Solution lost ¥15.6 B in the middle year and earned ¥43.4 B in the latest. Any ratio struck on a segment in a year it lost money is not a measurement, which is why the return columns above are shown for the latest year only.
Lawson, and why one segment appears to have collapsed
Smart-Life Creation’s gross profit fell from ¥806 B to ¥233 B across these three years — a fall of ¥573 B, more than two thirds — and its assets fell ¥1.9 tn. Read without context that is a business failing. It is not. It is an accounting boundary moving.
Lawson was a consolidated subsidiary at 50.1% until a KDDI tender offer in August 2024 took each party to exactly 50%. Neither controls it at that split, so it left the consolidation and became an equity-method affiliate. Its revenue and its assets came out of the segment; Mitsubishi’s half of its profit stayed, as part of one line further down the income statement. The year to March 2024 also carries a ¥122.5bn revaluation gain on the reclassification, which flatters that year and depresses the next year’s comparison against it.
The group balance sheet shows the same event: total assets fell ¥2.0 tn in the year to March 2025, from ¥23.5 tn to ¥21.5 tn. And it is part of why the equity-method share of profit has risen — Lawson’s earnings did not leave the company, they moved from the consolidated columns into the single equity-method line. Any growth rate struck across these three years carries that reclassification inside it.
| Segment | 2024 | 2025 | 2026 | Change |
|---|---|---|---|---|
| Mineral Resources | 4,379 | 4,538 | 5,995 | 1,616 |
| Environmental Energy | 2,875 | 3,247 | 3,339 | 464 |
| Smart-Life Creation | 4,662 | 2,587 | 2,745 | (1,917) |
| Urban Development & Infrastructure | 2,093 | 2,160 | 2,174 | 80 |
| Food Industry | 2,165 | 1,952 | 2,334 | 169 |
| Mobility | 1,976 | 1,848 | 1,943 | (33) |
| Power Solution | 2,731 | 2,512 | 2,740 | 9 |
| Materials Solution | 2,104 | 2,021 | 1,971 | (132) |
| Others | 3,282 | 3,153 | 3,235 | (47) |
| Adjustments and Eliminations | (2,808) | (2,523) | (2,325) | 483 |
| Group | 23,460 | 21,496 | 24,152 | 692 |
The other movement worth marking is Mineral Resources, which added ¥1.6 tn of assets over the three years while its net income fell ¥91 B. Capital going into the segment as returns come out of it is the normal shape of a resource business late in a cycle, and it is the largest single reason the group’s return on assets fell.
What management has committed to
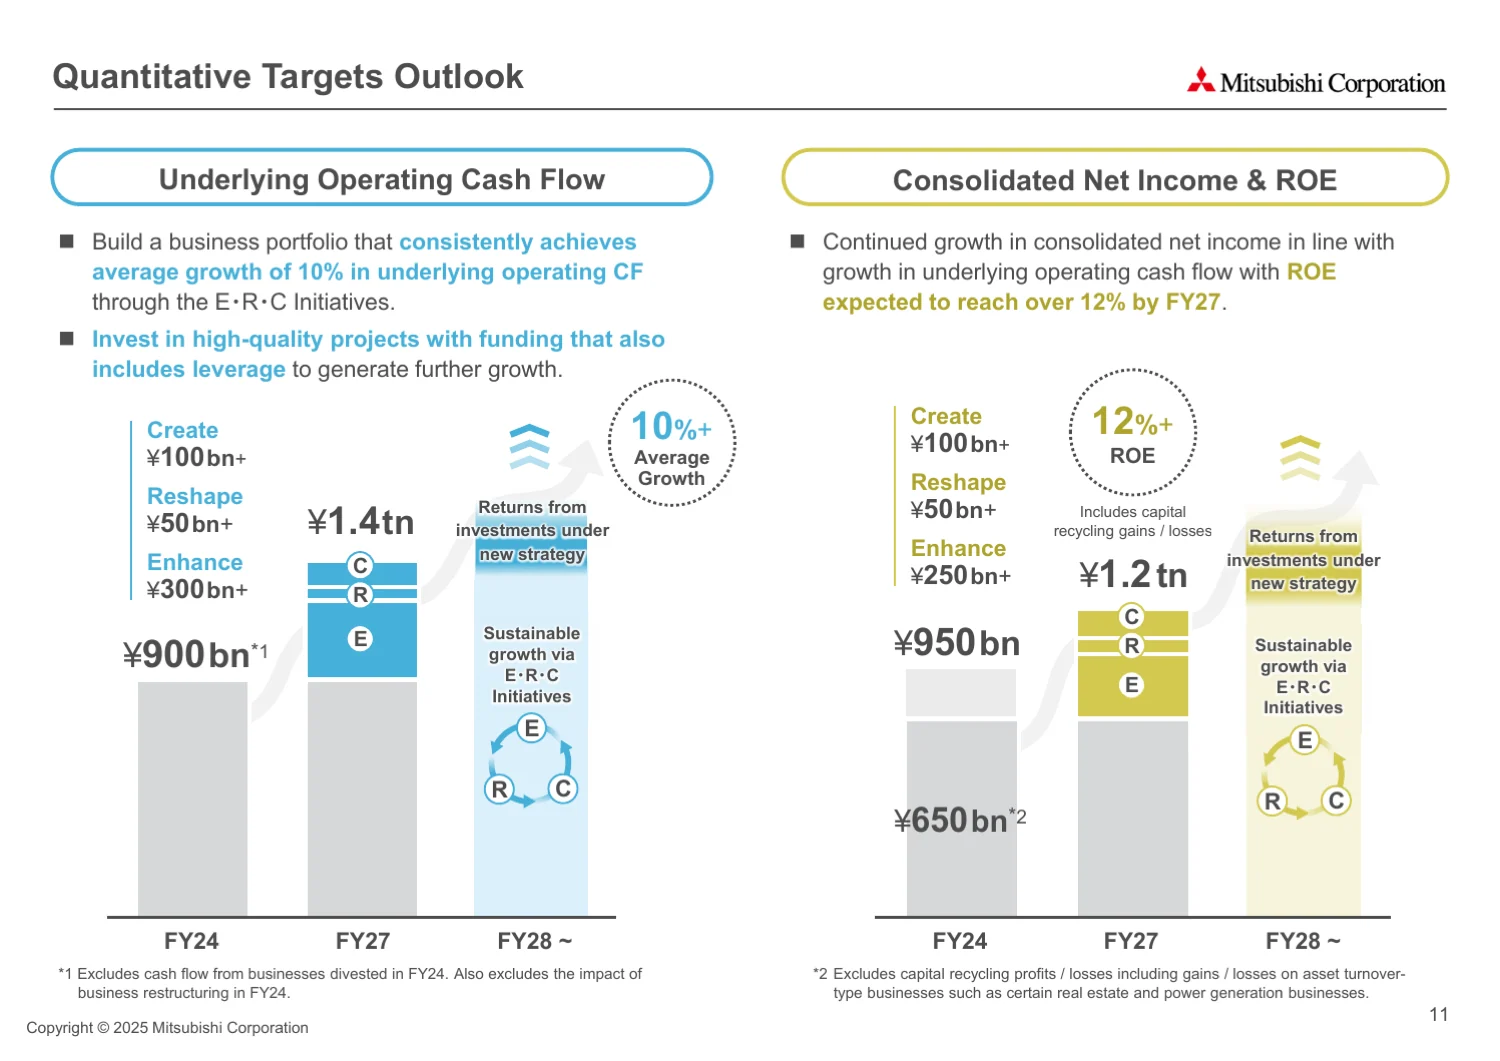
Corporate Strategy 2027 was published on April 3, 2025 and runs three fiscal years to 31 March 2028. The headline targets are 12% or better on equity, underlying operating cash flow growth of 10% a year or more, and a net debt-to-equity ratio capped at about 0.6×.
The profit target needs its year stated with it, because the plan does not put it in the same year as the return target. Net income is shown reaching ¥950 B in the year to 31 March 2028 and ¥1.2 tn only from 31 March 2029 onwards, while the 12% return is expected by the earlier of the two. Quoting “¥1.2 tn by 2028” — which is how the target is usually repeated — dates it a year early and makes the company look further along than it is.
| Item | Three years | Note |
|---|---|---|
| Underlying operating cash flow | ¥3.3 tn or more | Cash in |
| Divestitures | ¥1.7 tn or more | Cash in |
| Sustaining capital expenditure | ¥1.0 tn or more | Cash out |
| Growth investment | ¥3.0 tn or more | Cash out |
| Dividends | ¥1.4 tn or more | includes ¥200bn paid by subsidiaries to non-controlling shareholders |
| Share buybacks | ¥1.0 tn or more | Cash out |
What happened to the last plan
A target is worth what the last one turned out to be worth, and Mitsubishi publishes the scorecard. Midterm Corporate Strategy 2024 set a double-digit return on equity and reported a 12.5% three-year average; it set ¥800 B of consolidated net income and reported ¥950 B; it set a 40% payout and returned 62%, or ¥1.9 tn. It also reviewed 160 underperforming or low-growth companies. On its own terms the last plan was met.
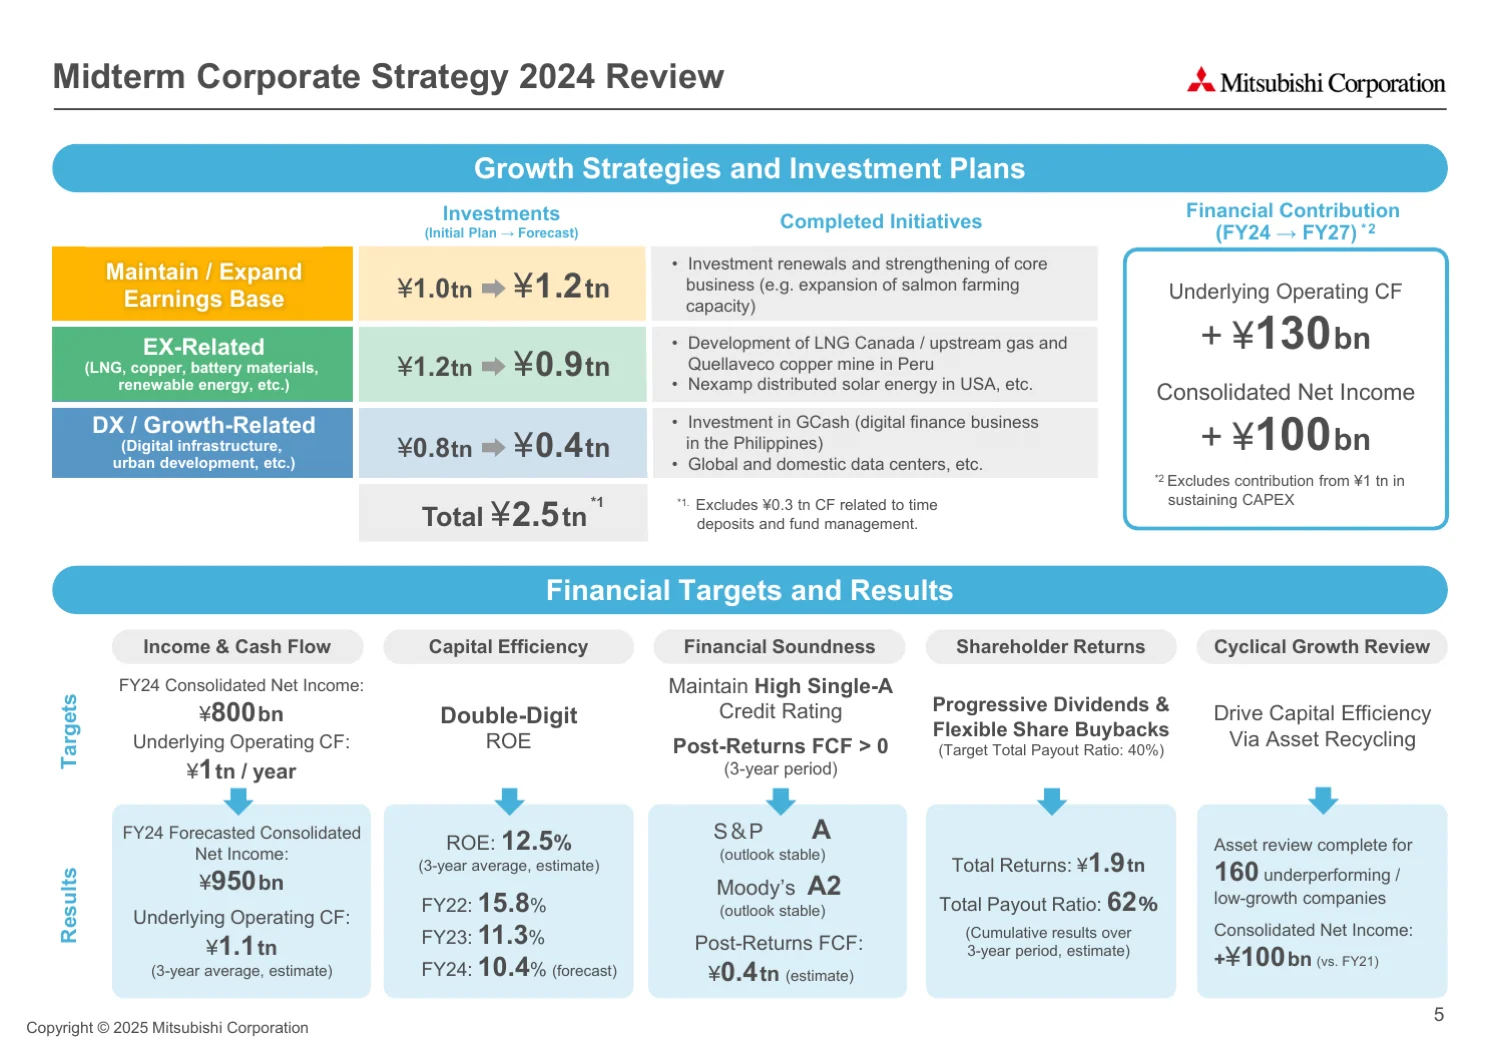
Two things are worth taking from it. The first is a check on this page: the return figures in that scorecard are the ones computed here from the accounts, year for year, under Mitsubishi’s labels rather than this site’s. The third is the exception and the reason is in the date — the plan was published on April 3, 2025, two days after that year ended and months before it was reported, so the slide carries a forecast where this page carries the filed figure.
| As the company labels it | Year ended 31 March | Scorecard | This page |
|---|---|---|---|
| FY22 | 2023 | 15.8% | 15.8% |
| FY23 | 2024 | 11.3% | 11.3% |
| FY24 | 2025 | 10.4% (forecast) | 10.3% |
| Three-year average | — | 12.5% | 12.5% |
The second is what an average does to a trend. Those three readings do not scatter around 12.5% — they fall, every year, from 15.8% to 10.4%. Each one cleared the target and so did the average, which is why the scorecard can report it met without qualifying anything. But a target set as a floor is silent about direction, and the direction was one way for all three years. The first year on the other side of the plan, the one this page is written on, came in at 8.5% — the first reading in four years that would not have cleared it.
That is the context for reading 12%. It is not a stretch from where the company has been — it cleared 12% in 2 of the ten years in the record, including 15.8% as recently as 2023. It is a stretch from where the company is, and the arithmetic earlier on this page is what that distance costs.
Two things in that table are worth flagging for anyone comparing the five houses on payout. The dividend line includes ¥200 B paid by subsidiaries to their non-controlling shareholders, which is not a payment to Mitsubishi shareholders at all — so a payout ratio struck on this figure is not comparable with one struck on dividends to the parent’s own holders. And the progressive dividend policy has a floor rather than a ratio: ¥110 per share, which against the ¥110 just paid is a commitment not to cut rather than a commitment to grow.
On the plan it replaced, management’s own scorecard is better than the target in every line. Midterm Corporate Strategy 2024 asked for ¥800 B of profit and reported ¥950 B; it committed to a double-digit return on equity and reported 12.5% as a three-year average; it targeted a 40% total payout ratio and delivered 62%, returning ¥1.9 tn. It also completed an asset review of 160 underperforming or low-growth companies.
That last item is the one to watch rather than the targets. A trading house with ¥24.2 tn of assets and ¥7.9 tn of it earning under two per cent does not have a profit problem that a good commodity year fixes. The 2027 plan introduces three-year profit and return-on-invested-capital targets for each operating company, and if those are ever published company by company they will be the most useful disclosure any of the five houses makes.
Conventions
Net income is attributable to owners of the parent. Return on equity is struck on average common equity, which is the basis Mitsubishi uses itself; for the decomposition to close, return on assets is struck on average total assets and leverage is average assets over average equity. That makes the decomposition unavailable for the first year of the series, which has no opening balance sheet, and this page leaves it blank there rather than quietly substituting a closing figure.
Segment shares are struck against the operating total, excluding adjustments and eliminations, because that row carries a negative asset balance and a negative denominator produces shares that sum to more than everything. The row itself is shown rather than netted away, since without it the columns do not tie. Market capitalisation is taken on the last trading day of each fiscal year. Figures are in yen throughout: this company reports in yen, is bought in yen, and a dollar-converted book value per share invites a comparison that does not mean anything.
Follow the research
New valuations and research notes, a few times a year. No promotional email, no sharing of your address, unsubscribe in one click.
Delivered by Buttondown. You can also subscribe by RSS.