
A year's profit, spent on an orebody that produces nothing until 2030
Mitsui earns more on its assets than Mitsubishi and less than Itochu, and carries the least borrowing of the three. None of that is what makes the latest year worth reading. The balance sheet grew by nearly a quarter in twelve months, and almost all of the new capital went to one place.
Capital expenditure came to more than the whole group earned, and nearly three quarters of it went to one segment, for an orebody that produces nothing until 2030. Return on equity fell to 10.2% in the same year. Both facts are the same decision.
- 1 Capital expenditure was ¥1,110 B — 133% of what the group earned — and 73% of it went to one segment. Mineral & Metal Resources spent ¥813 B against ¥90 B the year before, a 9.0× increase. Group capital expenditure rose 3.1×.
- 2 The balance sheet grew ¥4.0 tn in twelve months while profit fell. Total assets went from ¥16.8 tn to ¥20.8 tn — nearly a quarter of the opening balance sheet added in a year — as net income fell from ¥900.3 B to ¥834.0 B. Return on equity is 10.2%: 4.4% on assets times 2.3× leverage, the least borrowing of the three houses this site holds a balance sheet for.
- 3 Mitsui publishes a scorecard that shows the targets it missed. Of 4 quantitative targets in the last plan, 2 were met and 2 were not: core operating cash flow came in at ¥978.9 B against ¥1,000 B, and profit at ¥834 B against ¥920 B. No other house in this section prints a miss.
- 4 The plan is built on cash flow per share, not cash flow. Mitsui targets 8% a year compounded from 2013 to 2029 on core operating cash flow per share, having retired 19.7% of the shares over the decade. It is the only one of the five to set a target that way.
Where the company comes from
Mitsui Bussan is 150 years old as a trading company and 67 years old as this legal entity, and the gap between those two numbers is the whole post-war history of Japanese business in one line.
| Year | What happened |
|---|---|
| 1876 | Mitsui Bussan is founded as the trading arm of the Mitsui house, whose own merchant business dates from the seventeenth century. |
| 1947 | The zaibatsu is dissolved and Mitsui Bussan is broken into more than two hundred separate firms. |
| 1959 | The pieces re-merge into the company that trades today. |
A company broken into two hundred pieces and reassembled twelve years later is not the same institution that went in, whatever the name on the door. It is worth holding against the fifty-year language in the current plan: the half-century claim is made by a company whose own continuous corporate life is shorter than that.
What happened to the balance sheet
Most years at a trading house are a story about prices. This one is a story about a decision. In the twelve months to 31 March 2026, Mitsui’s total assets rose from ¥16.8 tn to ¥20.8 tn — an increase of ¥4.0 tn, or 24%, in a single year. Over the preceding nine years the balance sheet had grown 46% in total.
Profit went the other way, from ¥900.3 B to ¥834.0 B. Return on equity fell to 10.2%, the lowest since the year ended March 2021. Those two facts are usually read as a company having a bad year. Here they are closer to being one fact, and the segment note says where to look.
Group capital expenditure was ¥1,110 B, against ¥359 B the year before, a 3.1× increase. It was also 133% of the group’s net income for the year, which is to say the company spent more on capital account than it earned. And 73% of it went to Mineral & Metal Resources, whose own spending rose 9.0× from ¥90 B to ¥813 B.
A company can do that for two reasons. It can be defending a position that is eroding, in which case the capital is maintenance dressed as growth. Or it can be buying something it intends to own for a very long time. Mitsui says which one this is, and it is worth taking at its word for long enough to test.
What it bought
Rhodes Ridge is an iron ore deposit in the Pilbara, which Mitsui describes as one of the world’s largest undeveloped iron ore resources and among the highest grade in Australia. First ore is expected by 2030. The company’s own phrase for what the acquisition secures is “first-mover advantage in the industry over half a century” — a claim about the next fifty years, made in a document about the next three.
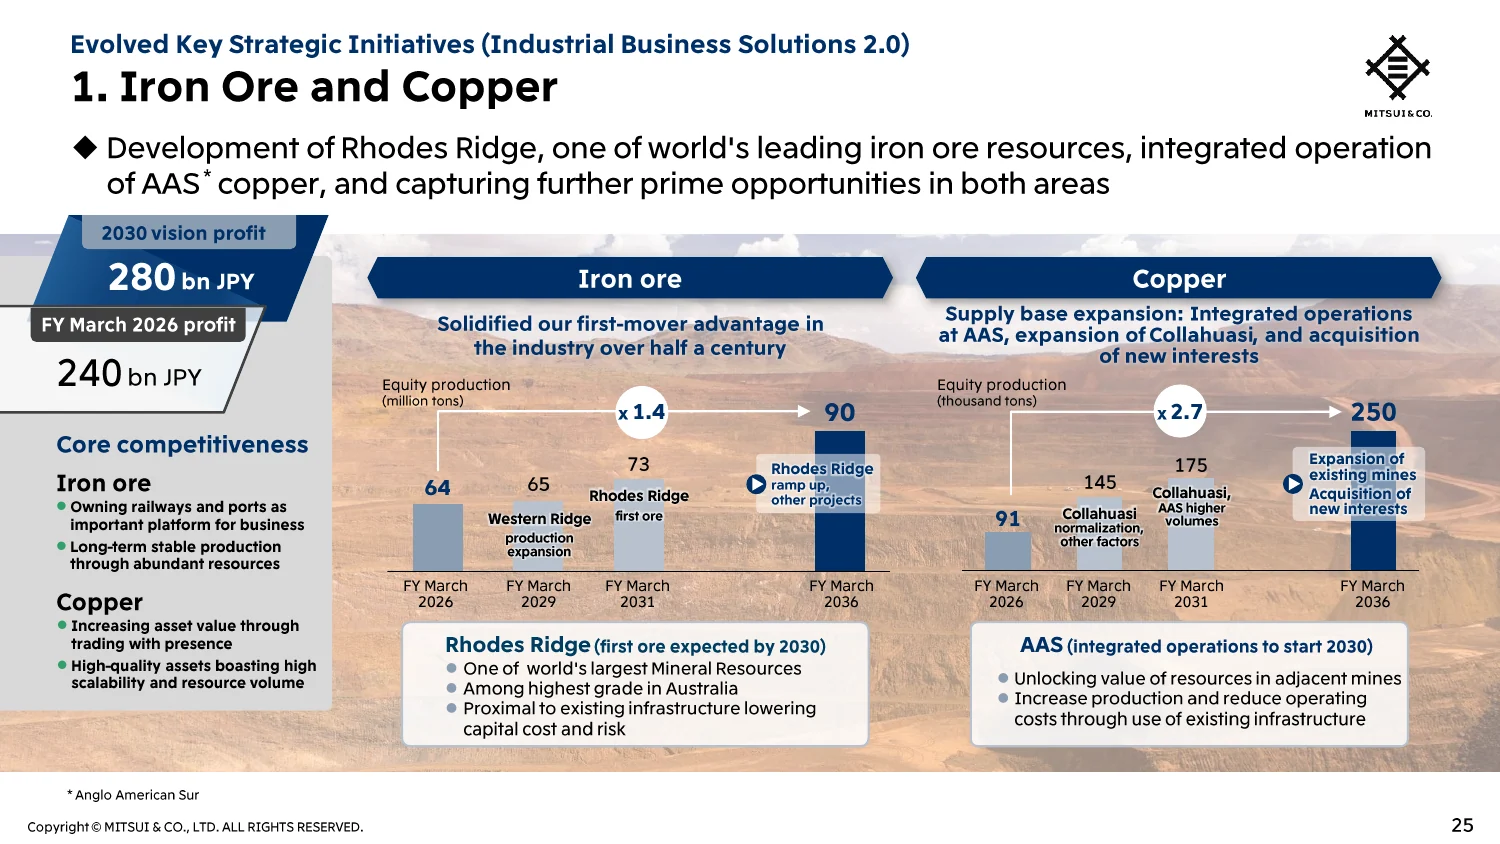
The figures on it are worth separating from the language around them. Mitsui’s equity share of iron ore production is 63.8 million tonnes now and 65.3 million at the end of the plan period — which is to say Rhodes Ridge contributes nothing inside the plan this document sets out. The growth the slide is drawn to illustrate is about 1.4 times FY2026 by FY2036, two plans after this one. Copper is the nearer story: 91 thousand tonnes rising to 145 by the end of the plan and 250 by 2036, through Collahuasi and through higher volumes at Anglo American Sur.
Put beside the profit the two commodities earn together today — ¥240 B — the ambition is ¥280 B by 2030. So ¥813 B of capital expenditure is not buying earnings inside this plan. It is buying a position, and the return on it cannot be assessed from anything in these accounts — which is exactly why return on equity reads the way it does this year. The capital is on the balance sheet and the profit is four years out. An investor who marks the company on this year’s 10.2% is marking the cost without the asset.
The same mine, on two of these pages
Anglo American Sur is a Chilean copper business — the Los Bronces and El Soldado mines and the Chagres smelter — and it appears twice in this section. Mitsui counts it among the assets taking its copper production to 250 thousand tonnes by 2036: Integrated operations with the adjacent Los Bronces mine, to start in 2030, alongside expansion at Collahuasi. Mitsubishi holds 20.4% of the same company, carried at ¥217 B against a cost of $4.51 billion — about 30% of what it paid.
Two of Japan’s five trading houses own pieces of the same orebody and describe it in opposite terms: one as a growth asset with a date on it, the other as a holding written down to a fraction of its cost. Both are right. They are answering different questions — what it will produce, and what it has returned.
The segments, and the capital each one carries
Mitsui reports seven operating segments and two rows that are not businesses. That second part is a shape neither of the other two houses has, and it has to be handled before any share below means anything: “All Other” carries ¥10.3 tn of corporate and financing assets against almost no profit, and “Adjustments and eliminations” carries negative ¥11.3 tn against them. They are a pair. Together they net to about negative ¥1.0 tn of assets and roughly nothing of profit, and both are excluded from the shares and the returns below.
| Segment | 2024 | 2025 | 2026 | Change |
|---|---|---|---|---|
| Mineral & Metal Resources | 335.1 | 285.4 | 253.6 | (81.5) |
| Machinery & Infrastructure | 248.7 | 232.9 | 225.9 | (22.9) |
| Energy | 281.7 | 173.5 | 164.2 | (117.4) |
| Chemicals | 39.2 | 75.9 | 67.5 | 28.3 |
| Wellness Ecosystem | 94.1 | 53.7 | 52.0 | (42.1) |
| Innovation & Corporate Development | 53.8 | 87.3 | 59.0 | 5.1 |
| Iron & Steel Products | 11.2 | 13.2 | 18.9 | 7.7 |
| All Other | 5.6 | (42.8) | 20.7 | 15.0 |
| Adjustments and eliminations | (5.9) | 21.5 | (27.7) | (21.9) |
| Group | 1,063.7 | 900.3 | 834.0 | (229.7) |
The basis moved after the year closed. Mitsui revised its operating segments on May 1, 2026, after the year above ended. The table is on the basis the accounts report; the new plan’s targets are on the revised one. The difference is a reallocation between Energy and what becomes Mobility, Digital & Infrastructure — the plan shows ¥157.8 B and ¥232.3 B where the accounts show ¥164.2 B and ¥225.9 B, and the pair sums to the same total either way. Nothing else moves.
Mineral & Metal Resources earns 30.2% of the profit on 19.8% of the assets, a spread of 10.3 points in its favour — and it is also the segment that has just absorbed 73% of the year’s capital. Wellness Ecosystem does the reverse: 6.2% of the profit on 14.2% of the balance sheet.
| Segment | Net income | Total assets | Share of profit | Share of assets | Spread, points | Return on assets | Capital spent |
|---|---|---|---|---|---|---|---|
| Mineral & Metal Resources | 253.6 | 4,313 | 30.2% | 19.8% | 10.3 | 5.9% | 813 |
| Machinery & Infrastructure | 225.9 | 4,427 | 26.9% | 20.3% | 6.5 | 5.1% | 25 |
| Energy | 164.2 | 4,181 | 19.5% | 19.2% | 0.3 | 3.9% | 168 |
| Chemicals | 67.5 | 2,242 | 8.0% | 10.3% | (2.3) | 3.0% | 34 |
| Innovation & Corporate Development | 59.0 | 2,655 | 7.0% | 12.2% | (5.2) | 2.2% | 18 |
| Iron & Steel Products | 18.9 | 862 | 2.3% | 4.0% | (1.7) | 2.2% | 8 |
| Wellness Ecosystem | 52.0 | 3,091 | 6.2% | 14.2% | (8.0) | 1.7% | 30 |
Wellness Ecosystem deserves its own line. It is the largest revenue line in the group at ¥3.4 tn — hospitals, healthcare and protein — and it earns 1.7% on ¥3.1 tn of assets, the lowest return of the seven. Its profit has fallen in each of the three years, from ¥94.1 B to ¥52.0 B, while its assets rose ¥189 B. Revenue is not the measure for a business like this and Mitsui does not claim it is, but a segment of that size earning under two per cent is the largest single drag on the group return.
Ten years of assets, equity and earnings
Return on assets and leverage are both struck on average balances, so they multiply back to return on equity exactly. Both are blank in the first year, which has no opening balance sheet to average against.
| Year | Total assets | Equity | Net income | Equity-method income | Return on assets | Leverage | Return on equity | Book value per share | Price to book |
|---|---|---|---|---|---|---|---|---|---|
| 2017 | 11,501 | 3,732 | 306.1 | 170.6 | — | — | 8.6% | 1,058 | 0.8× |
| 2018 | 11,307 | 3,975 | 418.5 | 234.9 | 3.7% | 3.0× | 10.9% | 1,144 | 0.8× |
| 2019 | 11,946 | 4,263 | 414.2 | 255.4 | 3.6% | 2.8× | 10.1% | 1,226 | 0.7× |
| 2020 | 11,806 | 3,818 | 391.5 | 269.2 | 3.3% | 2.9× | 9.7% | 1,118 | 0.7× |
| 2021 | 12,516 | 4,570 | 335.5 | 227.9 | 2.8% | 2.9× | 8.0% | 1,370 | 0.8× |
| 2022 | 14,923 | 5,605 | 914.7 | 431.3 | 6.7% | 2.7× | 18.0% | 1,751 | 1.0× |
| 2023 | 15,381 | 6,368 | 1,130.6 | 555.5 | 7.5% | 2.5× | 18.9% | 2,089 | 1.0× |
| 2024 | 16,900 | 7,542 | 1,063.7 | 491.6 | 6.6% | 2.3× | 15.3% | 2,518 | 1.4× |
| 2025 | 16,812 | 7,547 | 900.3 | 494.1 | 5.3% | 2.2× | 11.9% | 2,626 | 1.1× |
| 2026 | 20,822 | 8,768 | 834.0 | 447.4 | 4.4% | 2.3× | 10.2% | 3,094 | 1.9× |
The record runs from 8.0% in 2021 to 18.9% in 2023, with no loss-making year. 3 of the ten cleared the 12% the current plan asks for. The share count has fallen from 3,528 million to 2,834 million, a reduction of 19.7% — more than Itochu’s 10.8% and less than Mitsubishi’s 23.0%. The shares traded below book value in each of the first seven years of the record, as low as 0.7×, and stand at 1.9× — the highest multiple in the ten years, struck in the year return on equity came in at its lowest since 2021.
Ten years of segments
Mitsui is the only one of the five that has reported on one segment basis for the whole decade. For a page about capital allocation that matters more than it sounds: where the other four re-cut their reporting at least once, the lines below can be followed from {{ S.meta.firstYear }} to {{ S.meta.lastYear }} without crossing a definition change — so a business that was given capital can be checked against what it did with it.
Mitsui has reported on one basis for the whole decade — alone among the five. Every line below is comparable with itself in every year, which is what makes the rest of this chapter possible here and nowhere else in this section.
| Years | Segments | The basis |
|---|---|---|
| 2017–2026 | 9 | Nine segments, unchanged for ten years. The only house of the five that reported on one basis for the whole decade. Every line below is comparable with itself in every year, which is what makes a ten-year segment series possible here and nowhere else in this section. |
7 operating lines keep the same name throughout: Chemicals, Energy, Innovation & Corporate Dev., Iron & Steel Products, Machinery & Infrastructure, Mineral & Metal Resources and Wellness Ecosystem.
What the balance sheet holds now
The current basis, ranked by the assets each line carries against what it earns on them. 5 of the 7 earn less on their own assets than the group earns on all of its.
| Segment | Assets | Share | Profit | Return on assets |
|---|---|---|---|---|
| Machinery & Infrastructure | 4,427 | 20.3% | 225.9 | 5.1% |
| Mineral & Metal Resources | 4,313 | 19.8% | 253.6 | 5.9% |
| Energy | 4,181 | 19.2% | 164.2 | 3.9% |
| Wellness Ecosystem | 3,091 | 14.2% | 52.0 | 1.7% |
| Innovation & Corporate Dev. | 2,655 | 12.2% | 59.0 | 2.2% |
| Chemicals | 2,242 | 10.3% | 67.5 | 3.0% |
| Iron & Steel Products | 862 | 4.0% | 18.9 | 2.2% |
Over the ten years total assets grew 81.0% and equity 135%, against profit 172%. Those three are continuous whatever the segments did, which is why the group figures carry the long view on this page and the segment tables carry the detail.
What management has committed to
Before the new plan, the old one. Mitsui set 4 quantitative targets for MTMP2026 and reports against all four, including the 2 it did not reach. That is not the convention in this section — the equivalent page at Mitsubishi reports a plan met on every measure it set — and it is the main reason this company’s numbers are worth more than the average sogo shosha target.
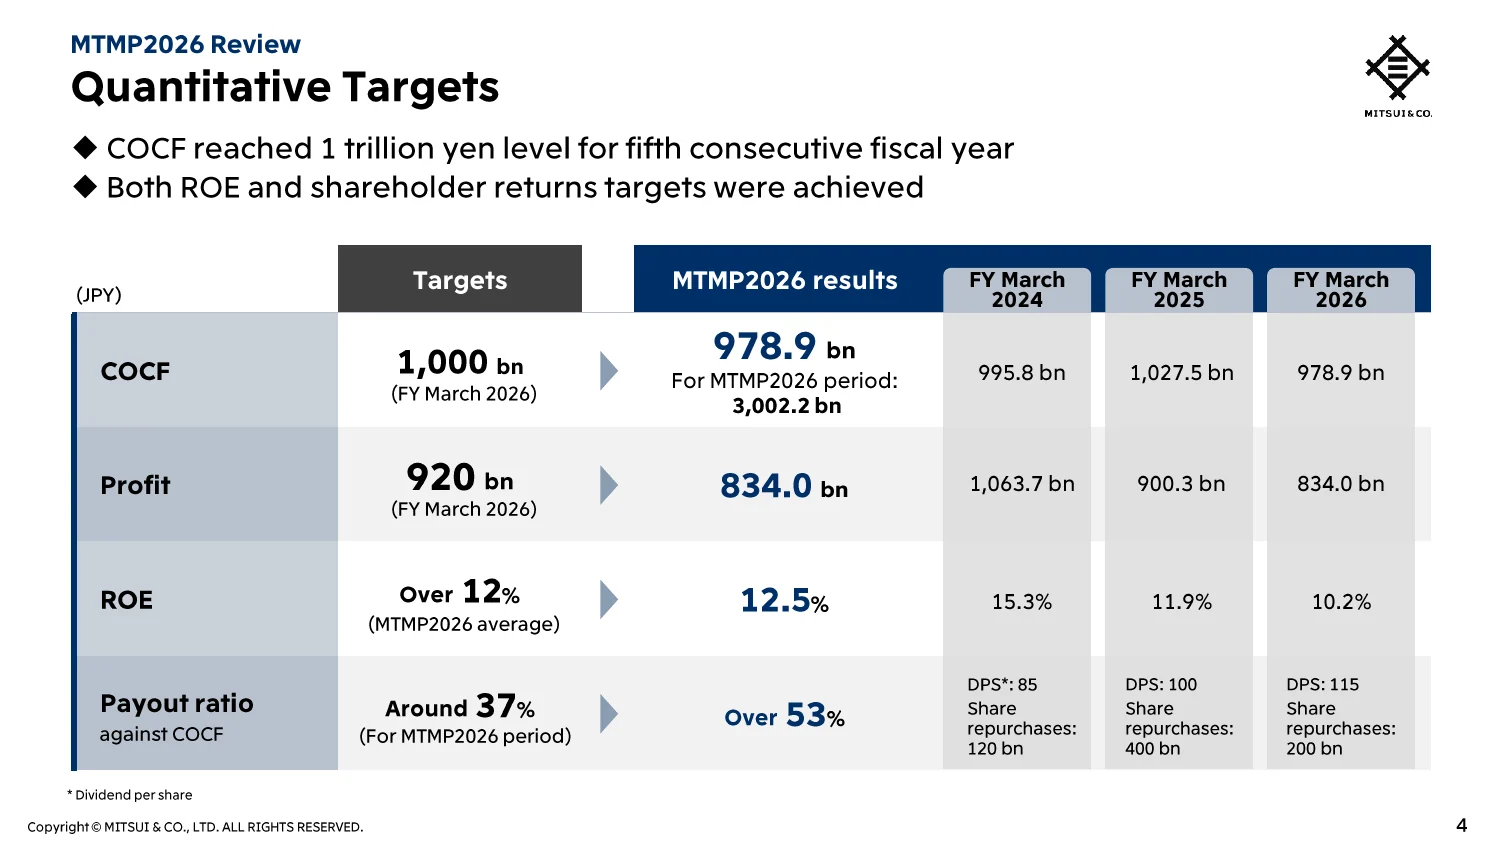
| Target | Set at | Came in at | |
|---|---|---|---|
| Core operating cash flow, year to March 2026 | ¥1,000 B | ¥978.9 B | Not met |
| Profit, year to March 2026 | ¥920 B | ¥834.0 B | Not met |
| Return on equity, three-year average | 12% | 12.5% | Met |
| Payout against core operating cash flow | 37% | over 53% | Met |
Read together, the four say something consistent. The two cash-return targets were beaten comfortably — the payout against core operating cash flow came in over 53% against 37% planned — and the two absolute earnings targets were missed. A company that returns more than it promised while earning less than it promised is one whose shareholders did better than its forecasts, which is an unusual way round.
| Year ended 31 March | Profit | Return on equity | Dividend per share | Buybacks |
|---|---|---|---|---|
| 2024 | 1,063.7 | 15.3% | ¥85 | 120 |
| 2025 | 900.3 | 11.9% | ¥100 | 400 |
| 2026 | 834.0 | 10.2% | ¥115 | 200 |
The three-year average return on equity of 12.5% cleared the 12% target, and every figure in the column fell. That is a target met by its first year and missed by its last, which is the same shape the dividend column does not have: the dividend rose in each of the three.
MTMP2029
The new plan runs three years to 31 March 2029 and targets ¥1.2 tn of profit, 12% on equity, and core operating cash flow of ¥1,100 B a year. The three-year cash plan is below.
| Item | Three years | |
|---|---|---|
| Core operating cash flow | 3,430 | Cash in |
| Asset recycling, planned | 1,310 | Cash in |
| Investment in existing businesses | 680 | Committed |
| Growth investment already decided | 970 | Committed |
| Dividends | 1,190 | Committed |
| Management Allocation | 1,900 | Undirected |
¥1.9 tn of the ¥4.7 tn coming in — 40% of it — is not allocated to anything. Mitsui calls this Management Allocation and says it will go to further growth investment or further shareholder returns depending on what turns up. It is a residual rather than a plan, and it is the honest way to present three years of cash that has not been committed yet. The alternative, which is to assign every yen to a named bucket and revise later, is how most of these documents read.
The cash flow target itself is a modest step: ¥3.4 tn over three years against ¥3.0 tn actually generated over the last three, a 1.1× increase. The dividend is a floor rather than a ratio — ¥140 per share as the minimum for the period. And ¥1.7 tn of the growth spending is tagged to three named initiatives: Industrial Business Solutions at ¥780 B, Global Energy Transformation at ¥690 B and Wellness Ecosystem Creation at ¥180 B.
Per share, which is the whole point
One slide in the plan does something none of the other four houses’ documents do: it tracks cash flow per share against the share count over sixteen years, and sets the target on the per-share figure.
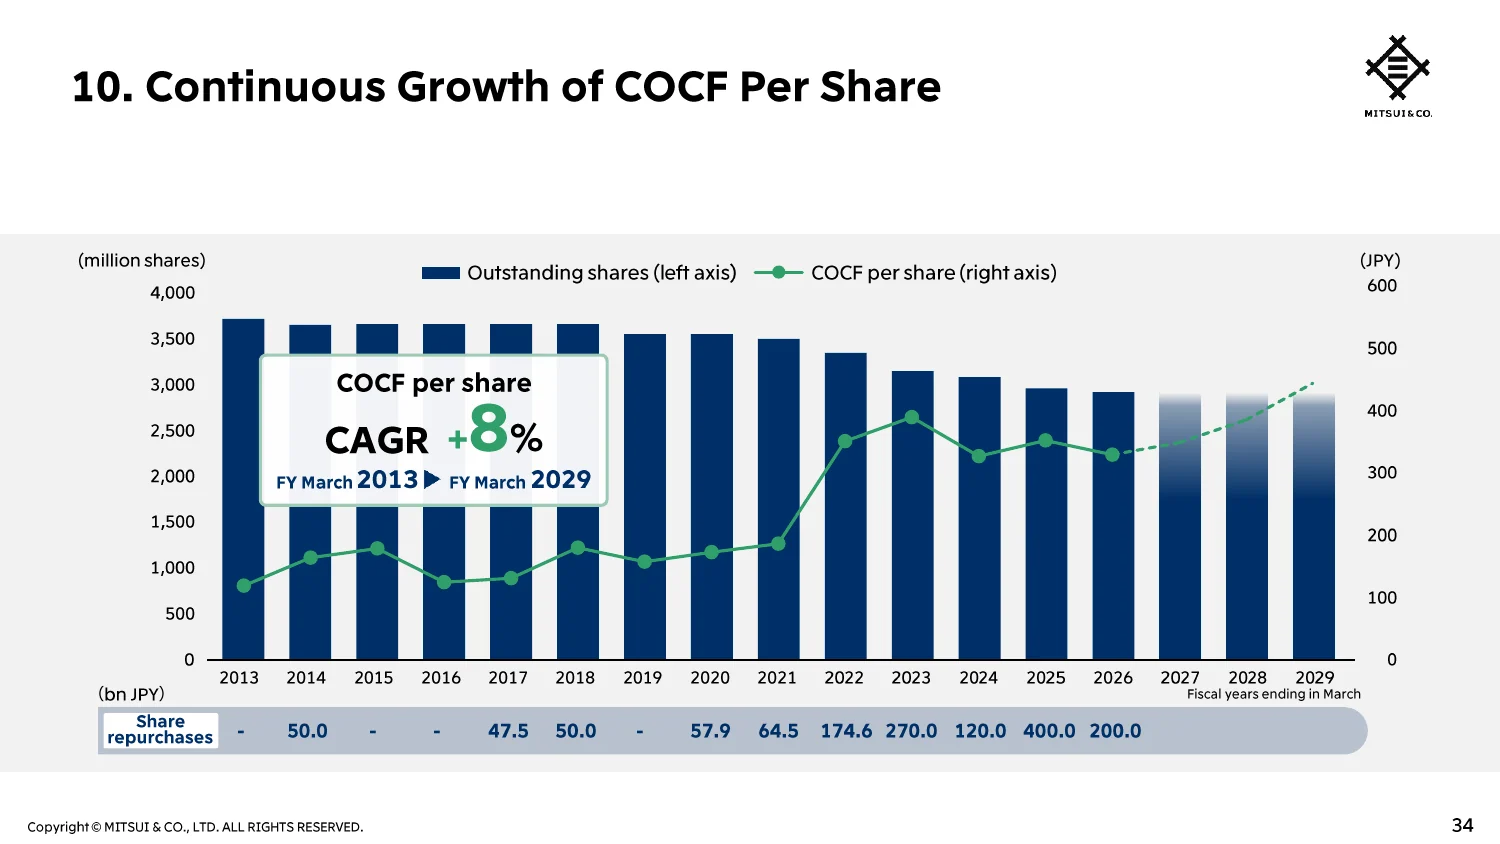
The bars fall and the line rises. That is the entire argument for a buyback drawn once, and it is the measure this site is named after: what matters to an owner is not what the company generates but what it generates for each share with a claim on it. Mitsui targets 8% a year compounded on that figure from 2013 to 2029, and has retired 19.7% of its shares over the ten years this page covers.
It also sets the capital decision in context. Spending 133% of a year’s earnings on an asset that produces nothing until 2030 depresses every per-share measure in the meantime. A company that publishes a sixteen-year per-share chart is inviting you to judge that decision on its horizon rather than on this year’s.
Conventions
- Fiscal years. Every column is labelled by the date it ends. The year ended 31 March 2026 is FY2026 to the data vendors and FY March 2026 to Mitsui; the plan years are labelled by their own end dates throughout.
- Return on equity. Net income attributable to owners of the parent over average equity, the mean of the opening and closing balances.
- Return on assets. Net income over average total assets, on the same basis, so that return on equity decomposes exactly into return on assets times leverage.
- Leverage. Average total assets over average equity. A balance sheet ratio, not a measure of net debt.
- Segment returns. Segment net income over segment total assets, both as the segment note reports them. Shares of profit and of assets are taken against the seven operating segments only.
- Capital expenditure. As reported in the segment note, shown as a positive outflow. It is the cash measure for the year and is not the same thing as the total consideration for an acquisition.
- Core operating cash flow. Mitsui’s own measure, abbreviated COCF in its documents. It is the basis of the plan’s payout ratio and is not comparable with the operating cash flow the other houses quote.
- Currency. Yen throughout, except the one dollar cost quoted for Anglo American Sur, which is a dollar figure in the source and is left in dollars rather than translated at a rate it never experienced.
Follow the research
New valuations and research notes, a few times a year. No promotional email, no sharing of your address, unsubscribe in one click.
Delivered by Buttondown. You can also subscribe by RSS.